Written by: Matthew D. Cann, Sean Hill, and Lav R. Khot, Ag Weathernet, Washington State University. November 21, 2022.
Growers need more accurate weather forecasts to make informed management decisions. AgWeathernet (AWN) has responded by developing station-specific models that reduce error by as much as 25-50%. Regional weather forecasts currently available from the National Weather Service or other providers often overgeneralize conditions in agricultural areas due to their coarsely gridded framework. Growers already utilize nearby, high-quality AWN weather station(s) as reference and have developed keen understanding of how the weather at particular stations relates to their fields and orchards. Therefore, AWN is developing station specific 10-day weather forecasts which are available at https://weather.wsu.edu/?p=120850&mobile.
How the Station-specific AWN Weather Forecasting Model Works
Systematic biases exist between the regional gridded forecast and a given weather station that can be corrected. The gridded framework is limited in areas of complex terrain where elevation, slope angle and aspect vary within one grid space (e.g., 2.5 x 2.5 km) as it can only represent one elevation of leveled terrain, typically an average of the elevation in the entire space. Thus, station-specific models may not be needed in areas of vast, flat terrain. However, any space with rolling hills, mountains, or canyons/gorges frequently find that a gridded forecast product is highly inaccurate. For example, the Columbia River Valley near Wenatchee, WA, is a narrow valley with steep terrain on either side. If the grid space includes the valley bottom and the tall mountainside, it cannot possibly provide an accurate representation of the weather at both locations. This scenario is where the station-specific model with historical weather data excels because it is able to relate the gridded forecast value to what is observed at a given station over months/years and make the appropriate correction. For example, the AWN site on Stemilt Hill south of Wenatchee, WA has one of the better improvements in air temperature predictions over the gridded forecast, i.e., 30% lower error for a 6-hour forecast and 22% lower error for a 24-hour forecast. Other areas along the Columbia River, Snake River, and upper Yakima Valley are where the station-specific model strongly outperforms the regional gridded forecast. These areas also tend to be some of the most difficult for meteorologists to forecast, demonstrating a strong need for improved station-specific forecasts.
The simplified approach of creating a station-specific weather model and how it is used in real time is shown in Figure 1. First you acquire archived station observations and gridded forecasts from a number of numerical weather prediction models. Then you train the models to make the correction based on the data. Using this approach, AWN currently provides forecasts for 160+ Tier 1 and 2 weather stations. At least one year of archived weather observations is preferred for modeling. We are working on additional AWN station-specific models as the archive continues to expand.
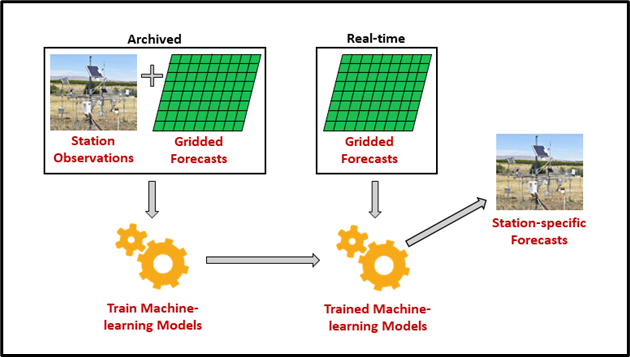
The AWN model is presently trained using historical gridded forecasts from three numerical weather prediction models: a global ensemble model, the Global Ensemble Forecast System (GEFS), a high-resolution model, the High Resolution Rapid Refresh (HRRR), and the National Weather Service’s blend of models (NBM), which combines numerical weather prediction models from across the globe to provide high-accuracy forecasts. The observations and weather model data are then cleaned for errors and ingested into machine-learning models.
We use supervised machine-learning models that essentially fit a mathematical formula to transform the input data to predict the outcome. The “supervised” aspect of the models means that we verified weather data from our stations, so we can tell the model what to predict. More observations means more accurate models because they are trained on additional independent weather events and are better able to fit the appropriate formula to predict future weather. A suite of machine-learning models were tested to find the best one for predicting each weather variable. A multiple linear regression model is used for air temperature, dewpoint temperature, relative humidity, inversion strength, and soil temperature, a k-nearest-neighbors model is used for solar radiation, and a random forest model is used for wind speed, gust, and direction predictions.
Trained models are then employed in real time (Fig. 1). The same gridded forecasts used to train the machine-learning models are obtained in real time and the data is converted to match the input of the trained models. The models use the real-time gridded model forecast and recent station observations to convert the inputs into station-specific forecasts with improved accuracy for our network of weather stations.
Real-time Weather Forecasts and Uses
Managers can access the forecasts by visiting https://weather.wsu.edu/?p=120850&mobile and selecting their local station(s) from the dropdown list. Note that if your station does not have a forecast available it will be added when sufficient historical observations have been collected. A 10-day hourly time series of available forecast data will be shown. Hovering the cursor on a desktop or your finger on a mobile device over the forecast will show a window with precise hourly predictions of each weather variable. Real-time weather forecasts like the one shown in Figure 2 are generated every six hours to keep the most accurate forecasts available. On average, the forecast error tends to increase over time. The average 1.5 m air temperature error for a one-hour forecast is around 1 °F and by the end of the 10-day period averages around 5 °F. Beyond 10 days the error becomes large enough that the forecast is of little use for decision making. A frequently updated 10-day forecast provides the best outlook for short- and long-term upcoming weather conditions.

The forecast can be used as either a direct source of information for decision making or as input into agricultural models such as growing degree day models or crop disease and pest models. Tower forecasts can provide valuable information for frost mitigation. The 5 ft (1.5 m) air temperature forecasts can provide accurate insight on the anticipated overnight low temperature and when critical thresholds are met. The towers also provide 30 ft (9 m) air temperature predictions, which can be used along with 5 ft (1.5 m) temperature predictions to determine the presence and strength of a temperature inversion. Wind machines are effective when strong temperature inversions exist but can be rendered useless on windy nights where there is no inversion.
The ultimate goal of the station-specific forecasts is to incorporate them into the various agricultural models and decision-support tools offered by AWN. For example, air temperature forecasts can be combined with solar radiation forecasts and inserted into an apple Fruit Surface Temperature (FST) model to predict heat stress and sunburn scenarios for a week in advance. Additionally, work is being performed at AWN to model the effects of operating above- and below-tree sprinklers on the air temperature and other atmospheric conditions, i.e., orchard effect. These models will work in conjunction with the station-specific weather model to predict the impact of sprinklers on the apple FST and allow growers to be prepared to make informed management decisions.
Contacts
Matthew Cann
AgWeatherNet Research Associate
matthew.cann@wsu.edu
Lav Khot
AgWeatherNet Director
lav.khot@wsu.edu
Fruit Matters articles may only be republished with prior author permission © Washington State University. Reprint articles with permission must include: Originally published by Washington State Tree Fruit Extension Fruit Matters at treefruit.wsu.edu and a link to the original article.