Prepared by: Ines Hanrahan and Felix Schuhmann, Washington Tree Fruit Research Commission
At a Glance
- Time commitment: Inducing bitter pit takes between 1 and 3 weeks. The Ethephon method (ethylene treatment) is usually the fastest test. The Penn State (shoot growth combined with nutrient) analysis takes at least 2 weeks.
- Accuracy: The Ethephon method is best. In general the lower the bitter pit in storage, the closer the prediction accuracy at harvest.
- Bitter pit severity: The 2017 experiment in 5 orchards had a range between 20 to 71% of fruit lost to bitter pit (field and storage combined).
- Economics: The input to outcome ratio is best for the Ethephon and Hot water methods. The Penn State method is labor intense and has an extra cost for the fruit mineral analysis.
Introduction:
All major apple varieties can develop preharvest and postharvest disorders, rendering them not marketable or lowering their value drastically. The apple cv. Honeycrisp is especially susceptible to develop a multitude of pre and postharvest disorders, but due to its high value this apple is often considered in replanting situations [USDA 2017] and has been one of the top varieties planted in Washington State in the first two decades of this century. A major problem in Honeycrisp cultivation is that the fruit is prone to bitter pit. High numbers of marketable fruit are lost every year to this particular disorder.
Bitter pit is a physiological disorder that begins in the orchards, but symptoms may appear in storage. In fact, clean fruit may be harvested which during storage develop dark and sunken spots on the apple surface. If the apple is cut open, brown and corky tissue is revealed. By predicting the incidence of bitter pit one may sustain in storage, the negative impact could be majorly reduced.
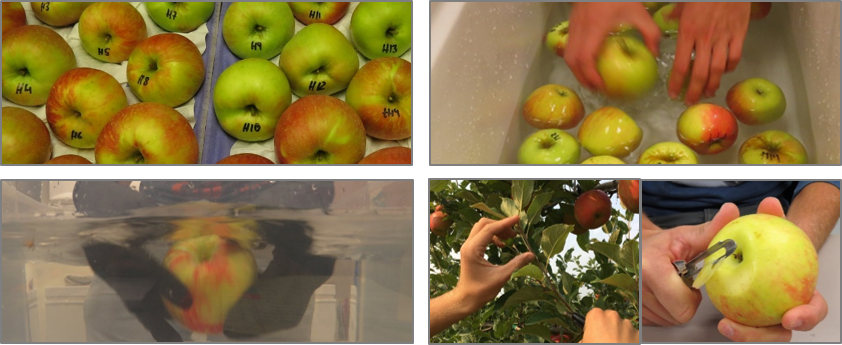
In other words, an easy and inexpensive test to be used close to harvest is needed to enable more accurate storage decisions while providing producers with a reliable indication of potential storage losses due to bitter pit. For this reason, the Washington Tree Fruit Research Commission compared four established methods used for this purpose in other growing regions (Baugher et al. 2017, Eksteen et al. 1977, Ostenson 2012, Torres et al. 2015). Three of the methods were repeated in 2016 and 2017 and one, the Penn State method, was added for the first time in 2017 (see Figure 1).
The Ethephon method, which was developed in South Africa, is also called Bangerth method (Eksteen et al., 1977).
Methods:
In 2017 five orchards were selected (3 orchards = all methods, 2 orchards = Penn State method only). Before the apples were harvested, the amount of bitter pit (BP) was assessed for each orchard. Symptom free fruit were harvested between the 2nd and 5th wire on the west or south side of the tree. The apples were picked a few days prior to first commercial harvest. For the Penn State method, 20 trees were selected and five typical terminal shoot measurements from each tree were taken. In the first three orchards, a total of 270 apples per orchard (passive method: 40, Ethephon method: 40, hot water method: 40, Penn State method: 20, untreated control (UTC): 120 and maturity sample: 10) were harvested. In the other two orchards, 150 apples per orchard were sampled (Penn State method: 20, control: 120 and maturity sample: 10). 20 representative trees were selected in each orchard.
Within 2 hours of harvest, fruit was prepared as follows:
- All fruit were washed in 77°F (25°C) tap water.
- The fruit were left to air dry.
- Hot Water Method (modified after Ostenson, 2012):
- A cooler was filled with hot water and adjusted to ~120°F (49°C).
- The apples were submerged in the hot water and held under water with warmed up hard plastic ice packs. If the temperature dropped below 115°F (46°C), hot water (~125°F) was added.
- After 30 minutes, the samples were taken out of the water and laid to dry on trays layered with paper towels.
- Ethephon Method (modified after Eksteen et al., 1977):
- A plastic box was filled with 2 gal (7.6 l) of water (temperature: 77°F) and 0.5 oz (15 ml) of Ethephon (1 gal= 0.25 oz) was mixed in.
- Every apple was dipped (2 sec) in the prepared solution.
- The samples were laid to dry on trays layered with paper towels.
- Passive Method (modified after Torres et al., 2015):
- Fruit were placed on trays and kept at room temperature (±72°F).
- All apples from these three methods were placed in apple boxes and stored at room temperature for 3 weeks.
- The fruit was evaluated after one, three, five, eight, eleven, fourteen and twenty-one days.
- PennState Method (modified after Baugher et al., 2017):
- A commercial fruit dryer was preheated to 160°F (71°C).
- A fruit peeler was used to remove a 3/8” wide (1 cm) strip of peel from around the circumference at the calyx end of the fruit.
- Samples were put on a drying tray and dried for 9 hours at 160°
After 9 hours the samples were stored in Ziploc® bags and sent to a laboratory for a nutrition analysis.
- The UTC fruit was stored following the Honeycrisp storage recommendations (Hanrahan and Blakey, 2017) and apples were evaluated after 2, 4, 6, 8 and 12 weeks of cold storage.
Results and Discussion:
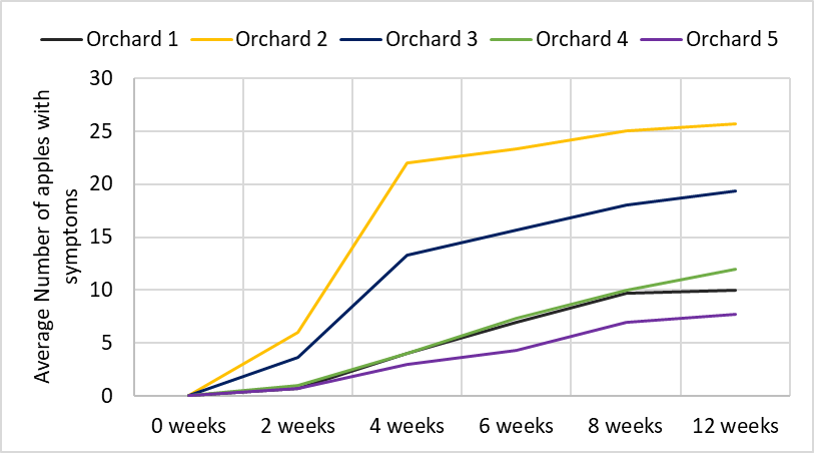
All UTC fruit showed a similar pattern in developing bitter pit. After 4-8 weeks of an exponential rise in bitter pit incidence, the expression of additional bitter pit in the remaining fruit slowed down and eventually approached zero (see Figure 2). After a 12 week storage period, Honeycrisp apples from orchard 1 showed in average 10 apples with symptoms (25%), from orchard 2, 26 apples (64%), from orchard 3, 19 apples (48%), from orchard 4, 12 apples (30%) and from orchard 5, 8 apples (19%) had developed bitter pit.
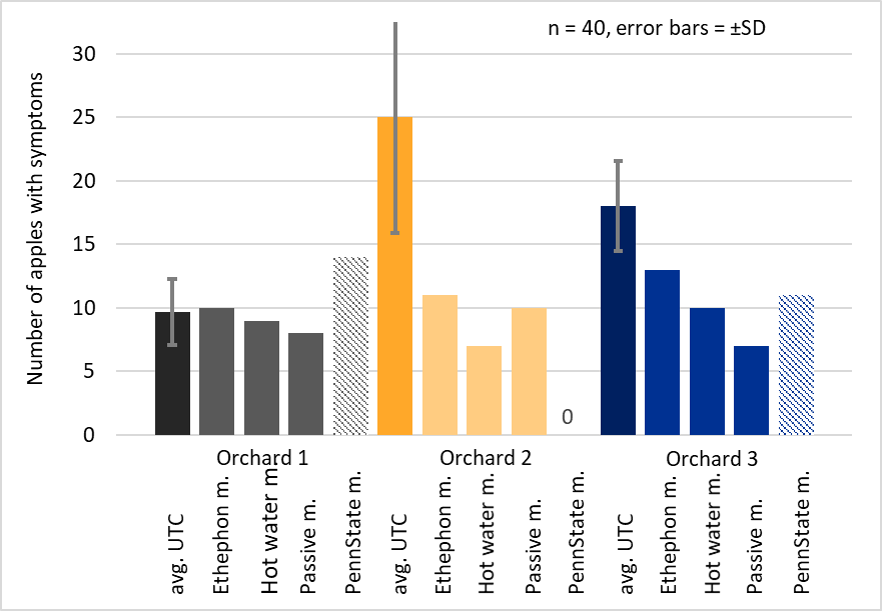
In orchard 1, all methods predicted the right amount of bitter pit (Figure 3). The Ethephon method was most accurate. In orchard 2 and 3 none of the methods predicted the amount of bitter pit accurately. Ethephon was the method with the closest prediction 37% and 33% off, respectively (Figure 3).
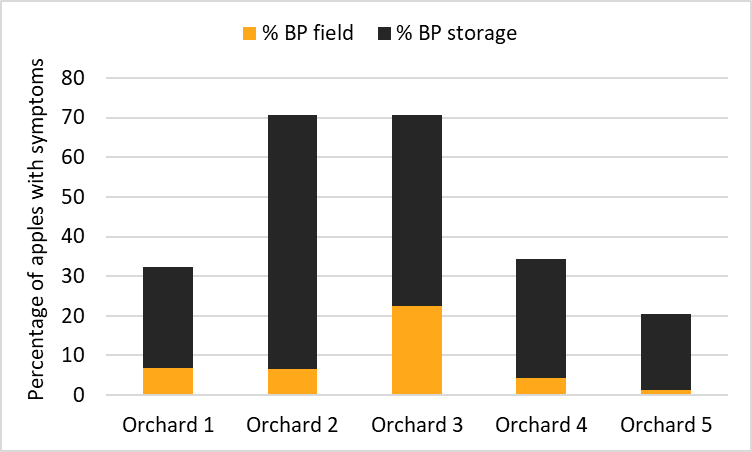
One aspect of bitter pit prediction that is not considered in any of the current methods involves the amount of fruit left in the orchard due to bitter pit at the time of harvest. The average in-field loss from bitter pit was between 1% and 22% (Figure 4). In both, orchard 1 and 2, we determined that 7% of fruit was left in the field due to bitter pit. Orchard 3 had more in-field bitter pit with an average of 22% of the crop with discernable bitter pit symptoms before harvest. Orchards 4 and 5 had a relatively small loss to bitter pit: 4 and 1%. After 12 weeks in storage, between 25% and 64% of the apples harvested symptom free had developed bitter pit. Orchard 1 developed 25%, orchard 2 64%, orchard 3 48%, orchard 4 30% and Orchard 5 19% bitter pit in storage. This means that one cannot predict storage bitter pit potential based on field symptom expression severity alone. For example: we had two orchards with low bitter pit incidence in the field (7%). However, one orchard developed 25% bitter pit in storage, while 64% of fruit from the second orchard developed bitter pit (Figure 4). The orchard with the highest preharvest loss due to bitter pit, was not the worst orchard for bitter pit development in storage.
Summary
All methods should be repeated for at least one more year, to generate reliable results. The 2017 data indicates that the Ethephon method is relatively fast, reliable and inexpensive. A general finding from 2017 is that all the methods predict bitter pit in storage better when in field bitter pit development was low. A major problem in evaluation of the Penn State method is the missing mathematical formula used to calculate percentages of bitter pit, which cannot be surmised from the published table (Marini and Baugher, 2017).
Acknowledgement: We would like to thank the cooperating growers and Garrett Bishop (G.S. Long, Yakima) for their generous donation of experimental fruit and laboratory costs.
Additional suggested reading material:
Bitter pit identification http://entomology.tfrec.wsu.edu/Cullage_Site/Physiol_BP.html
Contact:
 Ines Hanrahan
Tree Fruit Research Commission
hanrahan@treefruitresearch.com
Literature cited
Baugher Auxt, T., Marini, R., Schupp, J.R. and Watkins, C.B. (2017) Prediction of Bitter Pit in ‘Honeycrisp’ Apples and Best Management Implications. HortScience 52(10):1368-1374.
Eksteen, G.J., Ginsburg, L. and Visagie, T.R. (1977) Post-harvest prediction of bitter pit. Dec. Fr. Gr. 27(1), 16-20.
Hanrahan, I. and Blakey, R. (2017) Honeycrisp storage recommendations revisited. https://treefruit.wsu.edu/article/honeycrisp-storage-recommendations-revisited/
Marini, R., Baugher Auxt, T. (2017) Fruit Disorders – New Tool to Assess the Potential for Bitter Pit in Honeycrisp. https://extension.psu.edu/fruit-disorders-new-tool-to-assess-the-potential-for-bitter-pit-in-honeycrisp PennState Extension.
Ostenson, H. (2012) Learn to store Honeycrisp. http://www.goodfruit.com/learn-to-store-honeycrisp/ Good Fruit Grower (Article by Melissa Hansen).
Torres, E., Recasens, I., Peris, J.M. and Alegre, S. (2015) Induction of symptoms pre-harvest using the ‘passive method’: An easy way to predict bitter pit. Postharvest Biology and Technology 101(2015):66-72.
USDA (2017) Washington Tree Fruit Acreage Report 2017. https://www.nass.usda.gov/Statistics_by_State/Washington/Publications/Fruit/2017/FT2017.pdf