by Vincent P. Jones, Jay F. Brunner, and Geraldine Warner, originally published 1993
Why sample?
The reason for sampling is to base pest management decisions on the best information possible. A pest management program cannot work if it is based on false premises.
For example, if you mistakenly believe that the mite population in your orchard is below the treatment threshold you will not spray when you should, and this could lead to economic damage. Or, if you estimate the pest population to be above the economic threshold when it is actually below, you would spray when it was not necessary and waste money. In both cases, the fault was not in the treatment threshold or your pest management plan but in your estimate of the pest population.
Should I sample?
Sampling should be done if:
- The pest does not feed on the fruit.
- The pest has the potential to increase very quickly.
In this case you need a constant check on what is happening in the field. If pest populations do not vary much, there is little use in frequent sampling.
- You need accurate estimates to determine whether natural enemies will suppress the population.
If sampling shows they will not, then you may need to take treatment.
- You need to evaluate your pest controls.
Before-and-after comparisons will show if a pesticide application or introduction of natural enemies is working and if further control is needed.
- An accurate economic injury level for the pest is available.
Although sampling will estimate pest populations, it is most useful when an economic injury level has been established to indicate when control is needed.
Accurate estimates of pest populations allow you to compare its relative density from generation to generation and decide if it needs to be controlled. Data should also be saved from year to year so you can fine-tune your management programs based on past performance.
How often should I sample?
This depends on the biology of the pest and its natural enemies. For example, the western tentiform leafminer has 3 to 4 generations per year. The potential for population increase from generation to generation is high, but a generation can take a month or more to complete. It doesn’t pay to sample the leafminer more than once per generation unless you need to assess the degree of biological control. Weekly sampling of leafminer will show little change.
On the other hand, spider mite populations can complete a generation in 7 to 10 days during hot weather. Sampling should be done every 7 to 10 days so you are continually aware of what is happening before populations surpass the economic injury level.
What size should the sample be?
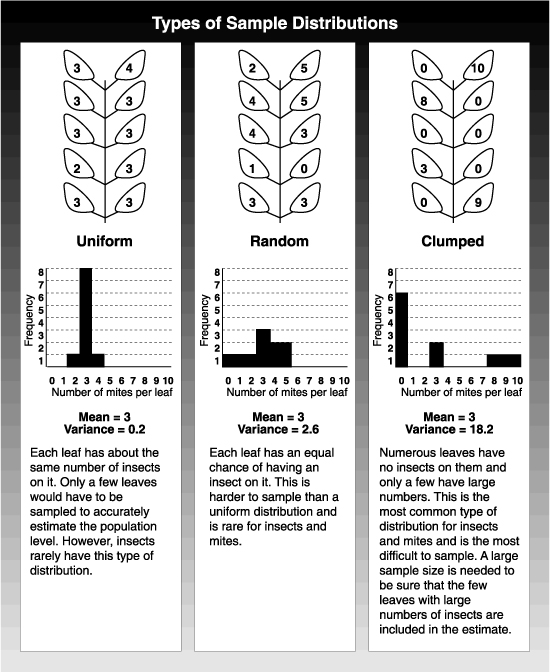
If you take a 10-leaf sample and find 30 mites, the average number of mites per leaf is 30 divided by 10, or 3 mites per leaf. This average, or mean, gives you important information about the population, but the mites could be differently distributed among the 10 leaves. By tallying the number of leaves that have no mites, then the number with one, then the number with two, and so on, you can work out a frequency distribution. In the uniform distribution, sampling even one or two leaves gives a close estimate of the mean population. Unfortunately, this sort of distribution is rare with insects or mites. The other extreme is the clumped distribution. Here, most leaves have no or few mites on them, while the remaining leaves have many. If you took a sample of three leaves and calculated the average, the estimate could vary from 0 to 9 mites per leaf. This kind of error in estimating mean populations leads to management mistakes. Unfortunately, this sort of distribution is typical of insect populations.
To decide how many samples must be taken to accurately estimate populations, it is important to know the ratio between the mean (or average) population density and the variance. The variance is a measure of the variation in the number of insects from leaf to leaf compared with the average population density. The ratio changes as the mean population changes, but it changes in a predictable way. With a large enough collection of samples, you can plot the relationship between the mean and the variance. From this, you can predict what the variance is from an estimate of the mean population density.
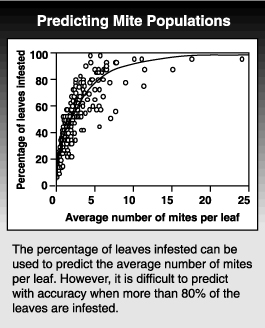 Knowing the relationship between the mean and variance also allows you to predict the distribution for any given population level. Using this relationship, we can predict how many leaves need to be sampled to give a certain degree of accuracy. Even more important, it allows us to use presence-absence sampling programs. If you know what percentage of the leaves are infested at a range of densities, you can estimate the average population density from just tallying the number of infested leaves without needing to count the insects. To show how well this works, you can plot the percentage of leaves infested and the average population level calculated from counting all the mites. The problem with this type of sampling plan is that estimates of the mean population density are unreliable when more than 80% of the leaves are infested.
However, presence-absence sampling can still be used by looking for the presence or absence of some easily recognized number of insects or mites, still without counting every one. For example, using the same relationship between mean and variance, we can predict the relationship between the mean and the percentage of leaves which have, say, 2 or more mites.
Samples using higher tally thresholds (2 or more, 3 or more, etc.) are still binomial samples in that each sampling unit is put into one of two classes. Although the term “presence-absence” is still used, you are no longer truly classifying on the basis of presence or absence. Several of the sampling schemes in later sections of this manual use a tally threshold of 2 or more (e.g. twospotted and McDaniel spider mites, Typhlodromus occidentalis, western tentiform leafminer). Because estimates are unreliable when more than 80% of the leaves are infested, the highest mean that can be accurately predicted with 2 or more mites per leaf is about 10.6. That compares with 6.7 mites per leaf for the normal presence-absence sample where all infested leaves are included. If this is still not high enough, you can count only the leaves with more than 3 mites or more than 4 mites, and so on. However, beyond a certain point you save less time with the presence-absence sampling because you end up counting many of the mites anyway to make sure they exceed your tally threshold.
Sequential sampling
If you know the distribution, you can set up a sequential sample. In a sequential sample the total number of leaves (sampling units) is variable. It depends whether or not results so far show that the treatment threshold is surpassed. This can be done either by counting the number of insects or mites, or it can be combined with presence-absence sampling. For monitoring purposes, it is often easier to sample a fixed number of leaves from a fixed number of trees that will give an accurate enough estimate when the average population level is near the economic threshold.
Sampling terms
Sampling unit: This can be an individual leaf, trap or fruit, on which insects are counted in order to estimate population levels.
Sample: A collection of sampling units used to estimate a population level. The number of sampling units in a sample is referred to as the sample size.
Precision: The repeatability of the sample. It is generally in the form of a ratio of the mean and its variance.
Mean: Average. The number of insects collected in a sample divided by the number of sampling units. It is the value most commonly used in decision-making for pest management.
Variance: The variation in the number of insects from leaf to leaf compared with the average population level. For example, at an average of five mites per leaf, some leaves might have no mites whereas other leaves could have 20 or more.
Frequency distribution: If you take a sample of 10 leaves and tally how many have no mites, how many have one mite, and so on, you create a frequency distribution. The shape of the distribution gives you a feel for the size of sample needed to accurately assess the mean population level.
Economic injury level: The lowest number of insects or mites that will cause economic damage, expressed as a number of insects per leaf or per plant part.
Treatment threshold: The population level at which control measurers are needed to prevent pest populations reaching the economic injury level. The treatment threshold is lower than the economic injury level, to allow time for control measures to take effect before the population reaches the economic injury level.
