Written by Basavaraj Amogi, Jake Schrader, Lav Khot, Gwen-Alyn Hoheisel. Washington State University, March 1, 2023
Cold Hardiness and Frost
As temperatures drop and daylength shortens in the fall, plants enter a phase called endodormancy in which plant hormones regulate perennial fruit crops to acclimate to the cold. Through fall and winter, each fruit crop and variety have a specific number of chill units that are required to release the plant from dormancy and avoid abnormalities with foliage, bloom, and fruit set. In Washington State, chill units are often achieved before the start of the new year. At that point, the fruit crop enters a stage called ecodormancy in which cold hardiness is influenced more by environmental conditions, making spring temperature fluctuations very important as the plant deacclimates to cold. Fruit crops adapt to freezing temperatures through a complex process called supercooling. Like adding salt on a sidewalk, plants increase the solute concentration by either reducing the bud water content or importing sugars into cells. However, cell damage can still occur through dehydration and osmotic stress when water freezes outside the cells and through the formation of ice crystals inside the cell that expand and rupture the cell walls (Rieger, 1989; Snyder and Melo-Abreu, 2005).
Frost events can be either radiative or advective and some frost nights can be a combination of both. Radiation events cause the plant temperature to decrease more rapidly than surrounding air and are associated with clear, calm nights and temperature inversions (i.e., temperature increases with height above ground) (Kalma et al., 1992; Campbell and Norman, 2012). Advection is when cold air moves into the field from wind flowing greater than 5 mph (Perry, 1998). Advection events do not allow the formation of temperature inversion layers and are difficult to manage with available frost mitigation technologies. However, radiative frost events can be mitigated using active methods such as (fixed or movable) wind machines, over/under tree water sprinklers, heaters, and protectant sprays. For precision activation of cold mitigation techniques, growers need tools to monitor temperature accurately during radiative frost events. While air temperature has been the most commonly used method for initiating mitigation, flower buds often experience a different temperature that can influence the hardiness and phenology (Peaucelle et al., 2022). The influence of air vs. bud temperature on frost mitigation and devices to measure both accurately is currently being researched at WSU AgWeatherNet and Center for Precision and Automated Agricultural System.
Novel Tools to Assess Bud and Air Temperature
Real-time weather data, forecasts, and models. WSU AgWeatherNet offers a range of decision support tools. For example, registered users can access real-time weather data, weather station-specific 10-day forecasts (more details), and daily frost reports through our Spring Frost Program. Additionally, some crop-specific cold hardiness models developed by WSU researchers
have been added on the website. These models run on station-specific weather data to provide estimates of LT10, 50, and 90 (lethal temperature/critical bud temperature at which 10, 50, and 90% of normal buds get killed). Registered users can also customize weather station-specific low temperature alerts for automated e-mail or text notifications.
Ground-based Proximal Sensing
A bud temperature can be measured using a variety of handheld sensing tools. Those include handheld wireless digital thermometers (e.g., Thermapen Blue, Thermoworks, UT) and infrared imagers (e.g., FLIR One Edge Pro, Teledyne FLIR LLC, OR) (Fig. 1). The latter is a surface measurement, and actual bud initials may have a slightly different internal temperature. Also, effective use of these handheld tools requires numerous samples around the farm block, which could be laborious.
Alternatively, a sensor network could be deployed with nodes spread across the orchard block. Each node of this network can consist of frost temperature sensors (e.g., Radiation Frost Sensor, Apogee Instruments, Logan, UT), air temperature probes, or an all-in-one weather sensor (e.g., ATMOS-41, METER Group, Inc., Pullman, WA) (Fig. 1). This network can provide real-time microclimatic data for sensitive areas. Data can then be visualized centrally, and an alert system can be developed to send push notifications to the block manager/farm crew.

Aerial Mapping of Inversion Strength
The wind machine’s performance is directly proportional to inversion strength, quantified as the difference between air temperature at two heights above ground level. Wind machines are effective when the inversion strength is >2℉ and plant temperatures can only be raised to 50% (maximum) of the inversion strength (Evans, 2000). So, if the inversion strength is 2℉, the wind machine can only increase the plant temperature by a maximum of 1℉. Therefore, if the measured inversion strength is not optimum on any frost night, then additional mitigation measures can be used.
Typically, a standard metrological weather station (e.g., AgWeatherNet Tier 1 tower) quantifies temperature at 5 feet and 30 feet above the ground level. However, wind machines are most effective when the warm air layer of the inversion is present between 15 to 75 feet above the crop. Therefore, it would be helpful if a grower operation could easily quantify inversion strengths from air temperature data at higher altitudes than a typical weather station height. Drones integrated with weather-sensing payloads could be ideal for this use. For example, we have integrated a small unmanned aerial system (UAS, a.k.a. drone, model: Mini 2, DJI, Shenzhen, China, cost: $650/unit) with a low-cost (~$500/unit) weather sensing payload (iMET-XQ2, InterMet Systems, Grand Rapids, MI, USA) as a quick inversion strength mapping tool (Fig. 2). The integrated payload measures and logs geotagged temperature (accuracy ± 0.54℉), relative humidity, and barometric pressure. For effective inversion strength quantification and decision support, follow the steps below:

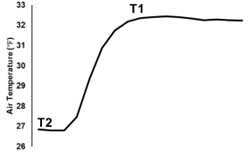
- Gather T2: Fly drone at 5 feet above ground and hover (stay at that place) for 30 seconds which will collect 30 air measurements (1 data point/sec)
- Gather T1: Then climb to the height between 15 feet to 75 feet above canopy/crop zone and hover for 30 seconds to log 30 measurements
- The data from the sensing payload needs to be downloaded via USB for visualization
- Calculate “Inversion Strength = T1-T2”
- Note that maximum possible temperature increase using wind machine would be “0.5 x Inversion Strength”
If the heights at which T1 and T2 are measured becomes difficult to track in the downloaded data, then look at the readings for pressure (decreases with height; minimum pressure = maximum height) and altitude corresponding to T1 and T2. Graphs can easily be generated using software that comes with sensor payload.
Aerial Mapping Using Thermal-infrared Imagery
Another drone-based solution would be to map orchard surface temperature using a high-resolution radiometric thermal infrared imager (e.g., FLIR Vue Pro R). Such maps can help quantify the in-field temperature variability and lead to strategically placing heaters and sprinklers to cover areas neglected by wind machines. For example, we mapped a sweet cherry orchard block with a 15% gradient during frost mitigation. The ground surface temperature map (Fig. 3) shows the temperature in different zones as the direction toward which the wind machine is blowing (a), down the hill where under tree water sprinklers were running (b), the area with no mitigation measures (d), and an area where the wind machine is not mixing air, also known as the wind machine shadow zone (c).

Aerial mapping requires special drone platforms with imaging sensor payload (total cost: ~$10,000) and specialized expertise. However, this is a one-time mapping and can be done at the beginning of the season.
Contact
Lav Khot
AgWeatherNet Director
lav.khot@wsu.edu
Acknowledgments
The ongoing projects are funded by USDA NIFA and WSDA SCBG. The authors would like to thank the grower collaborators Chelsea Durfey-Campbell (Lighthouse farms); Denny, Luke, and Seth Hayden (Hayden Farms); and Marcos Atilano and Keith Oliver (Olsen Brothers). We would also like to thank WSU Precision Ag lab group members Karisma Yumnam, Srikanth Gorthi, Gajanan Kothawade, and Ramesh Sahni for studying some of the decision support tools.
Additional Reading
Campbell, G.S., Norman, J., 2012. An introduction to environmental biophysics. Springer Science & Business Media.
Evans, R., 2000. Frost protection in orchards and vineyards. Washingt. State Univ. Coop. Ext. Pullman 59270, 1–20.
Kalma, J.D., Laughlin, G.P., Caprio, J.M., Hamer, P.J.C., 1992. Advances in Bioclimatology 2.
Peaucelle, M., Peñuelas, J., Verbeeck, H., 2022. Accurate phenology analyses require bud traits and energy budgets. Nat. Plants 8, 915–922. https://doi.org/10.1038/s41477-022-01209-8
Rieger, M., 1989. Freeze Protection for Horticultural Crops. Hortic. Rev. (Am. Soc. Hortic. Sci). 45–109. https://doi.org/10.1002/9781118060841.ch3
Snyder, R.L., Melo-Abreu, Jp., 2005. Frost protection: fundamentals, practice and economics. Volume 1. Frost Prot. Fundam. Pract. Econ.
Fruit Matters articles may only be republished with prior author permission © Washington State University. Reprint articles with permission must include: Originally published by Washington State Tree Fruit Extension Fruit Matters at treefruit.wsu.edu and a link to the original article.