Written by B. Sallato and L. Khot, February 2023.
A smart orchard project was implemented in two Washington apple orchards in 2020 in collaboration with several industry and university partners, with funding support from the Washington Tree Fruit Research Commission (WTFRC). This collaboration initiated a system that enabled the assessment and ground truthing of conventional and new soil characteristic mapping technologies. This aspect continues to evolve rapidly, overwhelming growers with alternatives and opportunities. In 2021 and 2022, Sallato and Khot joined the ‘smart orchard’ initiative to evaluate several soil mapping and testing methods as well as aerial imaging-based crop monitoring technologies to establish associated correlations with tree health, productivity and fruit quality. Here we summarize key findings on soil mapping technology. The complete report can be found at Washington Tree Fruit Research Commission website
SIGNIFICANT FINDINGS
- Aerial mapping tools provided equivalent maps for vigor/canopy density and orchard variability.
- Freely available historical aerial imaging (e.g., from application like Google Earth Pro) can provide generalized variability maps, however without reference values for productive indicators.
- WebSoil Survey (USDA) application, has the largest amount of soil characteristic information such as soil chemical, physical, environmental and health indicators among others. However, this information is available at a macro scale and require verification with on-site evaluation.
- On-demand ground vehicle-based soil mapping using SoilOptix® provided variable maps with good precision for elevation, texture, CEC, Ca, Mg, and B. These maps provided accurate relative differences. However, some of the indicators did not correlate well with the absolute values and may limit its use as a guide to determine nutrient availability or fertilization application rates.
- On-demand E.C mapping correlated well with soluble salts. However, as salts were variable and influenced by soil moisture, such maps should be used as a snapshot of a condition in time. For more accurate and useful E.C mapping, we recommend sampling with consistent soil moisture levels prior to planting.
- Overall, mobile elements such as NH4, NO3, S, Na, and B, were variable throughout the season, regardless of the soil type. Thus, not a reliable indicator of soil variability or nutrient supply. However, excessive levels of any of these elements in soil can provide insights on infiltration, drainage, and soil depth.
- Mapping strategies were useful tools to identify different growing conditions, which will help guide planting and irrigation strategies. However, all mapping tools required ground truthing and on-site analysis to determine cause of variability.
METHODS
We characterized mapping tools described in Table 1. We utilized the existing variability of a 16-acre grafted ‘Honeycrisp’ apple orchard, located in Grandview, WA. The mapping tools were contrasted with on site evaluation of four distinct areas: site 1 (S1) and site 3 (S3) being low vigor areas, while site 2 (S2) and site 4 (S4) high vigor areas. Productive parameters were recorded on a tree basis, including fruit and shoot growth, fruit size, weight and yield per tree and defects, as well as soil chemical analysis.
Table 1. Soil mapping methods and evaluation frequency in the smart orchard.
| ID | Mapping method | Frequency/timing |
| 1. SO | SoilOptix® – gamma radiation mapping | 2 / Spring – Fall |
| 2. EC | Electric Conductivity mapping by Simplot | 1 / 2021 |
| 3. SW | Web Soil Survey (NRCS, USDA) | 1 / Historic |
| 4. GE | Satellite imagery at 591 inches/pixel from Google Earth Pro | 1 / Historic |
| 5. UAS | 5-band multispectral, radiometric thermal infrared imagery at ~2.76 inches/pixel | 7 / Season |
Brief description of mapping tools
- SoilOptix® (SO) utilizes a pre-calibrated gamma radiation sensor mounted on a vehicle, approx. 2 ft off the ground, travelling through each orchard row at 12 mph. The sensor measures soil Caesium-137, Uranium-238, Thorium-232 and Potassium-40 which are then interpolated to create soil geospatial maps. Three soil samples need to be collected and sent to a certified laboratory for standard soil physical and chemical analysis. Utilizing predicting models, SO provides 27 maps at a resolution of 335 data point per acre. Mapped parameters included texture (silt, sand, clay), organic matter (OM), cation exchange capacity (CEC), calcium (Ca), magnesium (Mg), potassium (K), phosphorous (P), nitrate (NO3), pH, aluminum (Al), boron (B), copper (Cu), iron (Fe), manganese (Mn), sodium (Na), sulfur (S), zinc (Zn), plant available water (PAW) and elevation. For more information visit SoilOptix.
- ECmapping is the measurement if the electric conductivity (E.C.) in soils using a pre-calibrated equipment. This mapping services is provided by Simplot. It measures soluble salts which correlated with texture and moisture content of the soils.
- Soil Web Survey (SW) developed by NRCS, USDA, is an open-source database that provides macro scale data and mapping. The data can include soil ecological, physical, chemical, and biological parameters at different soil depth; however, it will vary depending on the surveyed area.
- Google earth Pro (GE) provides macro scale historic satellite images.
- Aerial imagery was collected with Unmanned Aerial System (UAS) mounted with five-band multi-spectral imaging sensors (RedEdge3, Micasense Inc., Seattle, WA) and thermal infrared sensor (FLIR DUO Pro R, FLIR systems, Wilsonville, OR). The aerial images were collected during the season and orthomosaiced images were analyzed to derive canopy heat, evapotranspiration (ET), and Green-NDVI maps.
RESULTS AND DISCUSSION
The Grandview ‘Honeycrisp’ orchard was described by the grower as a highly variable site with low pack outs, with small fruit size and bitter pit (BP) being the most important fruit quality culls. The orchard had two distinct areas of low and high vigor. Two sites for each of these areas were selected: being S1 and S3 low vigor, while S2 and S4 of high vigor. In 2021 and 2022, we confirmed that these areas were indeed distinct in vigor and fruit quality.
In 2022, fruit and shoot growth vary between the four sites (Figure 1), with lower vigor in S1 and higher in S4.

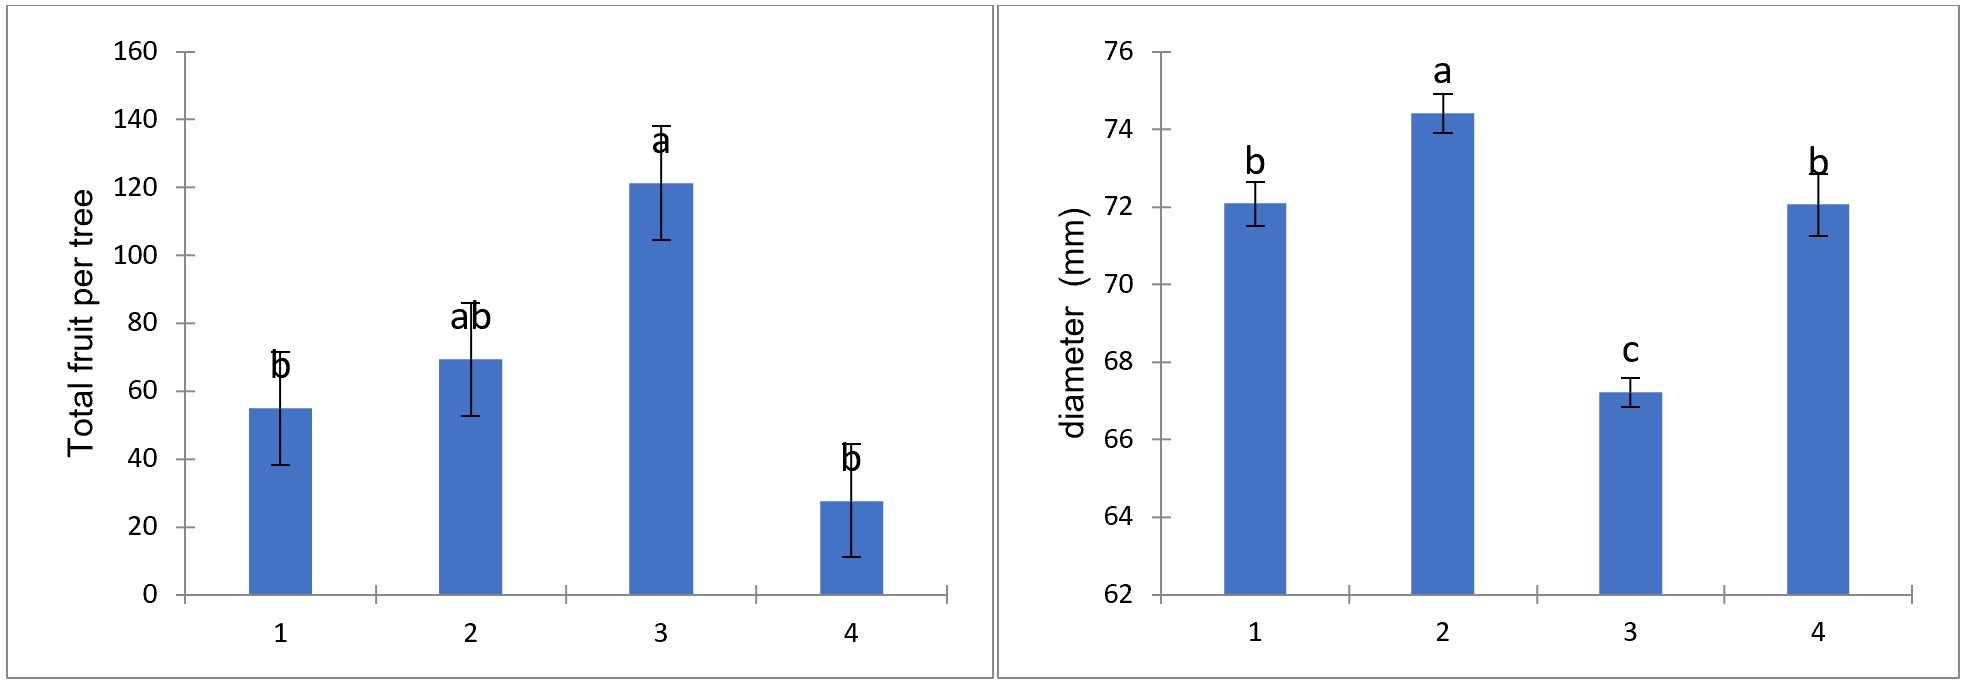
Total fruit count per tree varied tremendously, between 2 and 135 fruit per tree, being 4.4 and 2.2 times higher in S3 when compared with S4 and S1, respectively (Figure 2. Left). Consequently, fruit size at harvest was 11% smaller in S3 (67 mm, 150 box size) (Figure 2. Right).
Bitter pit (BP) levels were highly variable in 2021, ranging from 74% and 1%. Similarly in 2022, BP levels were also variable, being lowest in S3 (2%) and highest in S4 (52%) (Figure 3. left). In 2022, cracks and splits accounted for 26% of overall fruit damage, being highest in S3 (64%), while not observed in S4 (Figure 3. right).

Thus, when estimating productivity, accounting for fruit yield, size and defects, both S1 and S3 were the most limiting sites (also considered the areas with lowest vigor). Site 4 was intermediate, with estimated 12 bins per acre yield and 10 packs per bin. Site 2 was the most productive (or less limited) with estimated 23 bins per acre and 17 packs per bin (based on 20 bu/bin and 42 lb/bu). In agreement, the warehouse reported 45.5% packable fruit with estimated 9.6 packs/bin average for this block, with most culls associated to undersized fruit, BP and cracks/splits.
On site Profile Analysis
Soil profile analysis were utilized as complementary tool to determine the cause of variable production, fruit quality and defects. Soil pits demonstrated great variability in texture, structure, effective depth, effervescence, porosity, root growth, drainage, and chemical conditions (Figure 4). Here, S1, located in the south-east side of the block was associated to Hezel loamy fine sand, with low OM and water retention, thus few roots were observed in the top strata. Most roots were concentrated below 30 inches deep. Sites S2 and S3 were associated to Warden silt loam soil. However, S2 had deeper effective soil depth, with 24 inches of sandy loam, where roots were concentrated in the first 5 to 24 inches. While S3, had a reduced effective soil depth, with roots concentrated in the first 7 to 10 inches followed by a massive (compacted soil) with low water infiltration and signs of anoxia. Lastly, S4 was associated to Starbuck silt loam soil, and while it had shallower soil depth (16 inches) over rock, there were no signs of anoxia, abundant roots, and moisture (Figure 4).
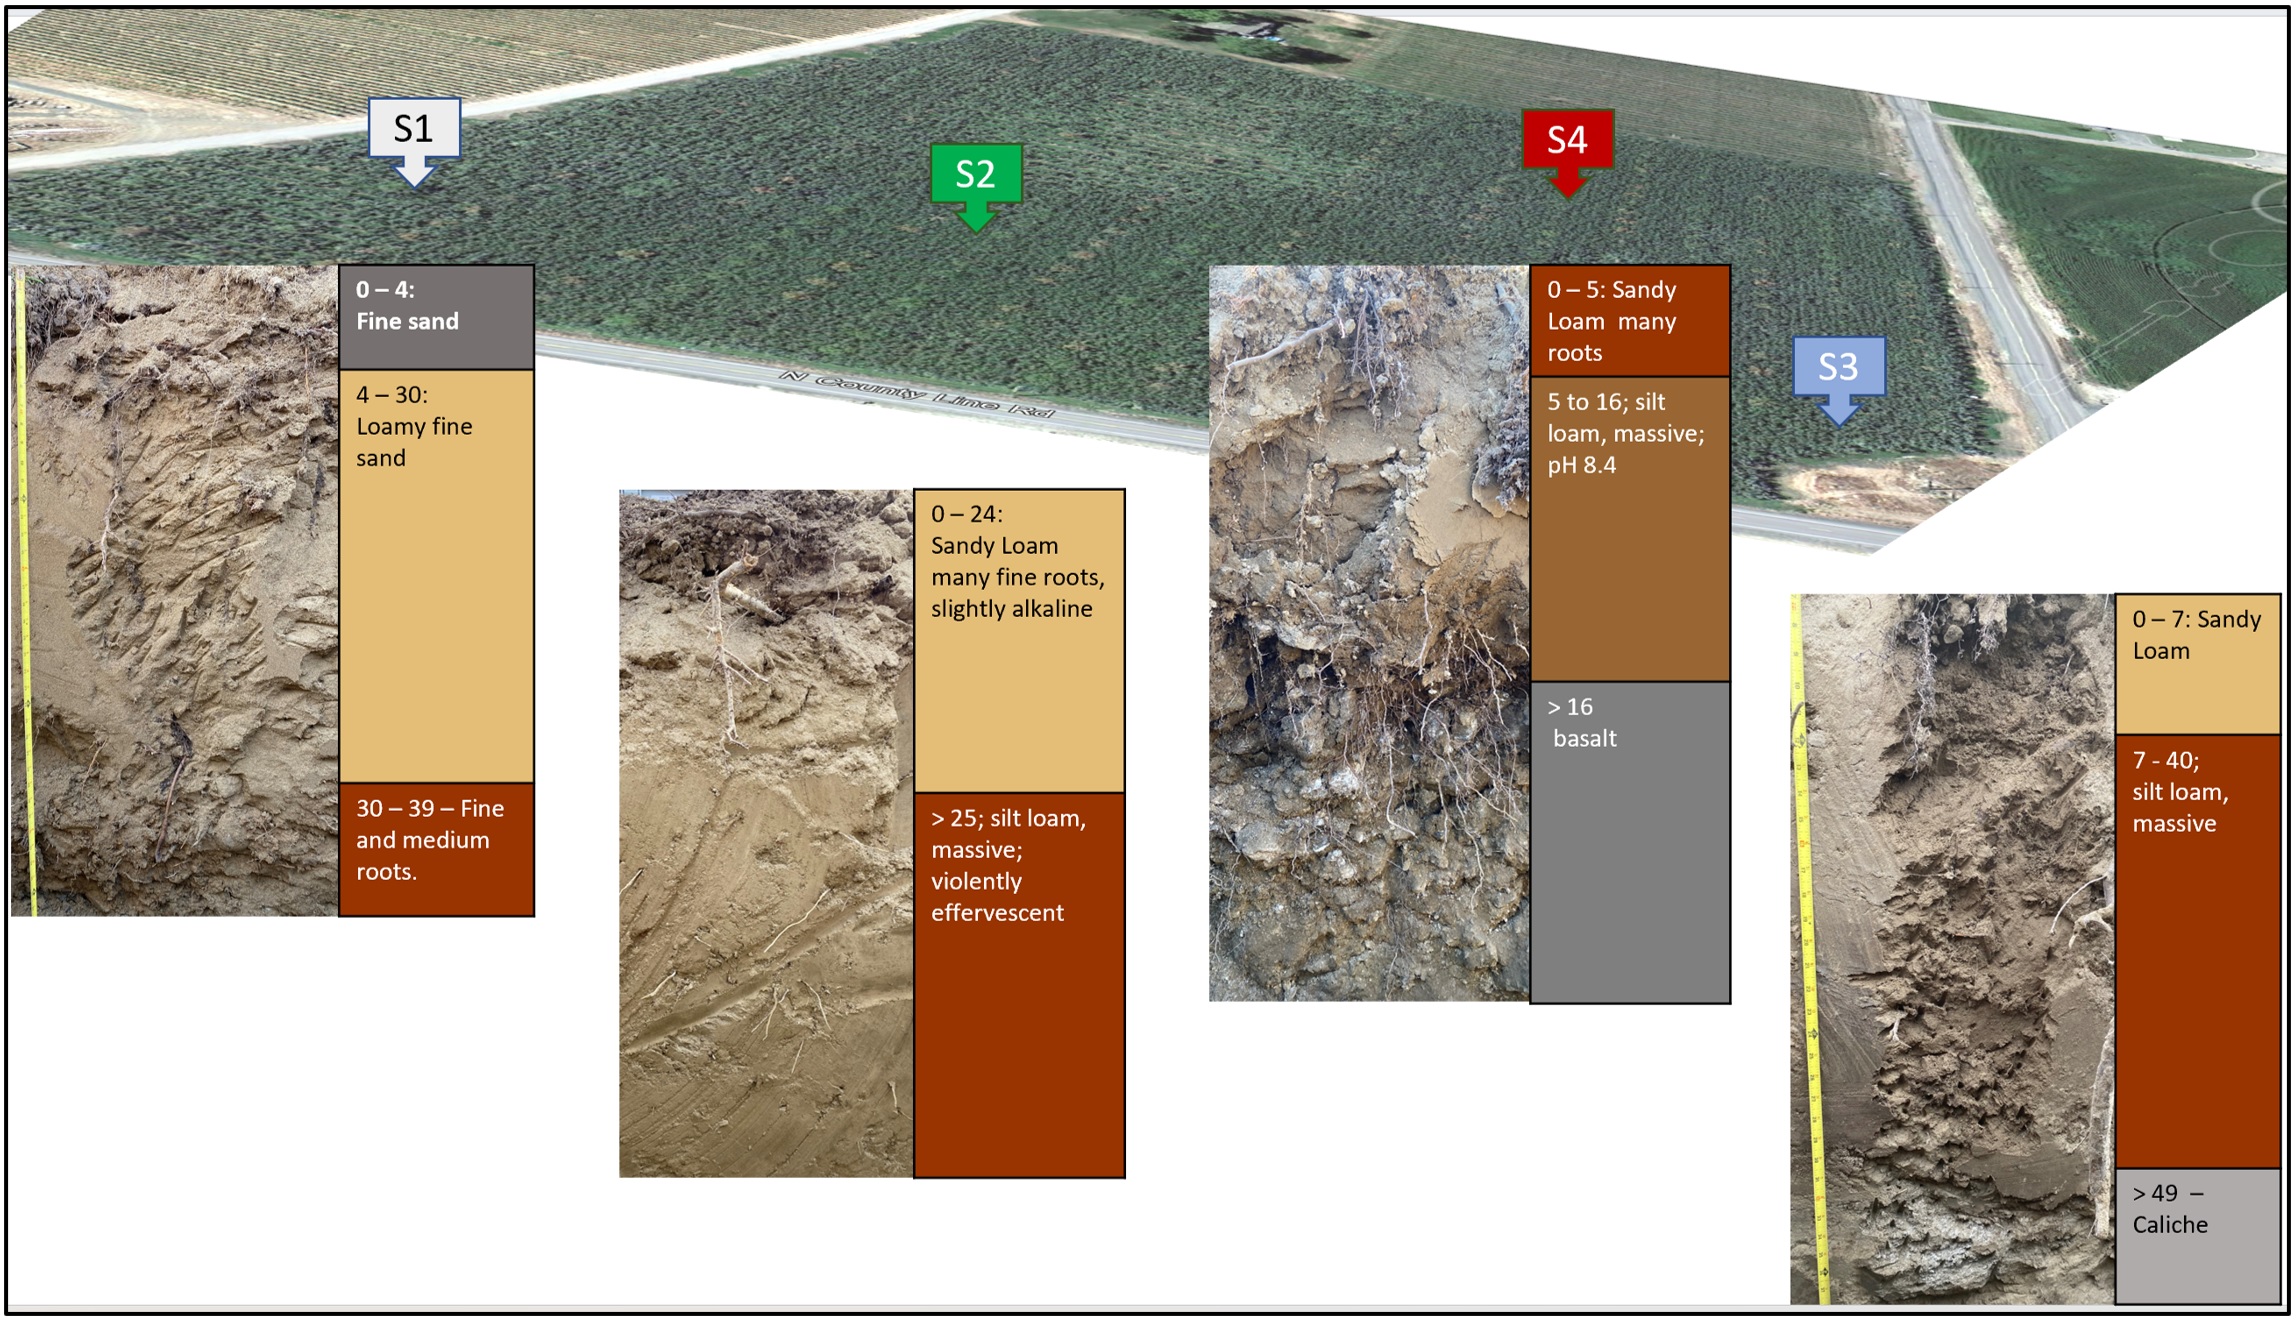
In this study, on site profile analysis provided insightful information to determine the cause of variable growth and fruit quality. In S1, the excessive drainage and reduce water retention led to reduced roots near the surface and nutrient deficiencies (especially for on-mobile elements such as P). In contrast, S3, also associated to low vigor however with high cracking/split incidence, roots were concentrated in the upper 7- 10 inches, evidencing signs of anoxia and lack of drainage. Sites S2 and S4, both associated to higher vigor, however in S4 had greater root volume, consequently higher vigor, lower crop load and higher BP incidence.
Based on the natural variability of the block in terms of growth, quality, and fruit defects, we evaluated several mapping tools to identify their capacity to predict and inform these conditions.
Mapping tools
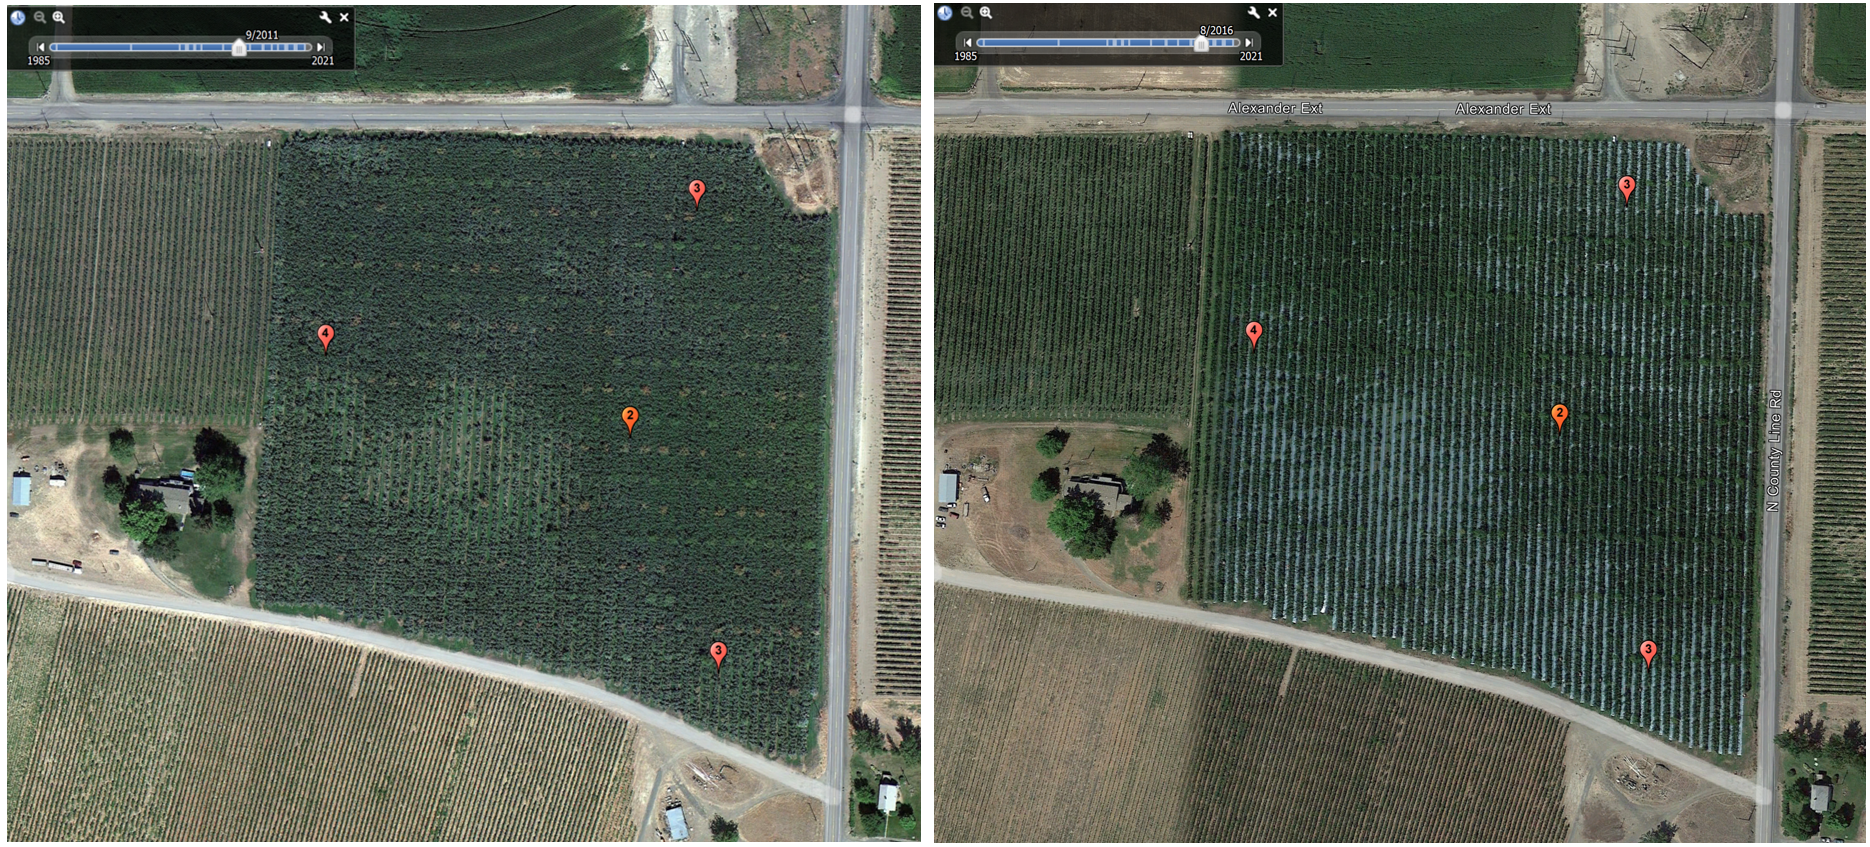
The GE and UAS imagery were good predictors of canopy density differences, distinguishing areas with low vigor (S1), versus areas of higher vigor (S4). UAS imagery mapping had greater precision (micro scale) and provided predicted values for heat, evapotranspiration, and canopy vigor. Thus, UAS based aerial imaging should coincide with growing stages. Such imagery, especially thermal infrared mapping should be avoided when overhead cooling systems are running. GE satellite images do not have absolute values for further analysis, in free version. In our area of study, there were 27 historic images of the site since 1985, varying in quality and resolution level. Given that area has been cultivated since 1996, there were several images (dates) that provides useful variability maps. For example, in Figure 5, the image on the left (September 2011), shows variable canopy density in the previous apple cultivar (before grafted). The right image (August, 2016), shows similar variability of the current cultivar (‘Honeycrisp’), where the reflective under tree material provided a better background to highlight the canopy difference.
The Soil survey service (SW), provided the largest amount of information: including elevation, parental materials, ecological, physical, chemical, and biological indicators, water content and availability, among others. Here, the orchard was associated to five soil series; Hezel (1.6%), Quincy (1.4%), Starbuck silt loam (12.7%) and Warden (72.4%) (Figure 6). When contrasting the results with on-site profile analysis, we distinguished three series: Hezel near S1, Warden, on S2 and S3 and Starbuck around S4. As warned in the web page, the level of precision requested was beyond the scale the application is intended to be used (scale of 1:20,000 to 1:24,000), thus such data should be utilized as a guide to support on-site analysis if higher precision is needed.

The SoilOptix® and EC mapping tools utilize a sensor payload that needs to be driven through the orchard rows to generate the map (Figures 7 and 8). For the SoilOptix®, three soil samples from distinct areas should be collected and sent to a testing laboratory for chemical and physical analysis that then is utilized to build different maps. Here, SoilOptix® had a strong correlation with texture, elevation, OM, Ca, Mg and B, while weak correlation with pH, K and NO3, and no correlation with other chemical indicators. Given the variability of pH, K, NO3, and B throughout the season, these correlations were not sustained at different timings. In addition, absolute values provided by SoilOptix® were not equivalent with the standard soil test, thus should not be used as absolute reference to determine nutrient availability or rate. Regardless, SoilOptix® provided useful maps with relative differences of texture, elevation, Ca, Mg, B, which can be complemented with on-site analyzes to estimate nutrient availability and management.

Similarly, EC mapping provided three levels of EC across the orchard (Figure 8). The EC map correlated well with on-site analysis of soluble salts and E.C., where S1 and S4 were low and S2 and S3 were intermediate. However, given the variability of EC throughout the season, and dependence on soil moisture content, the observed correlation was strong with one sampling time. EC should be used preferentially prior to the growing season, with moist soils (not saturated or dry), to obtain a more consistent and informative maps.

A summary of pros and cons is provided in Table 2. While all tools provided useful information, the precision (scale) level vary widely, being highest with UAS and lowest with SW. All mapping tools needed to be ground truth (on-site verification) to determine the cause of the variability, nutrient availability and to guide management practices.
Table 2. Pros and cons of mapping tools evaluated on Grandview apple Honeycrisp orchard.
| Tool | SO
Soil Optix ® |
EC
Simplot |
SW
WebSoil Survey |
GE
Google Earth Pro |
UAS
Drone |
| Method | Motorized Vehicle | Motorized Vehicle | Satellite | Satellite | Unmanned Aerial System |
| Information | Physical and chemical | Electric conductivity | Physical, Chemical, Environmental | Canopy | Canopy vigor,
Heat, Water use |
| Operation | Third party Service | Third party Service | Online | Online | Third party Service |
| Precision | High | Medium | Low | Low | High |
| Cost | $$ | $ | Free | Free | $$ |
| Frequency | Once | Once | Once | Anytime | Annual |
| Timing | Prior to
planting |
Prior to planting | Prior to
planting |
Prior to planting | Growing season |
| Notes | Good mapping relative differences of texture, Ca, Mg and B. Not to use for absolute levels of nutrient availability. | Good mapping of E.C.
Note that E.C is highly variable in the season, and dependent on texture and moisture. |
Largest amount of information at a macro scale information. | Useful tool for mapping canopy relative differences. However, will depend on the history of the site. | Useful tool to map canopy and estimate areas of stress at a micro scale. |
Summary
In this case study, mapping variability tools helped to identify differential areas and sampling. While in-depth evaluation, combining different diagnostic tools such as soil test, profile analysis and root growth, provided clues to determine the cause of tree and fruit quality variability.
Contact
Tree Fruit Extension Specialist
Mail: b.sallato@wsu.edu