In a non-typical year like 2018 models are more important than ever to help guide decisions in the orchard. Take a look at models new this year: Flower phenology: Cripps Pink, Gala, Red Delicious; Honeybee foraging; Fruit growth: Cripps Pink, Gala, Red Delicious.
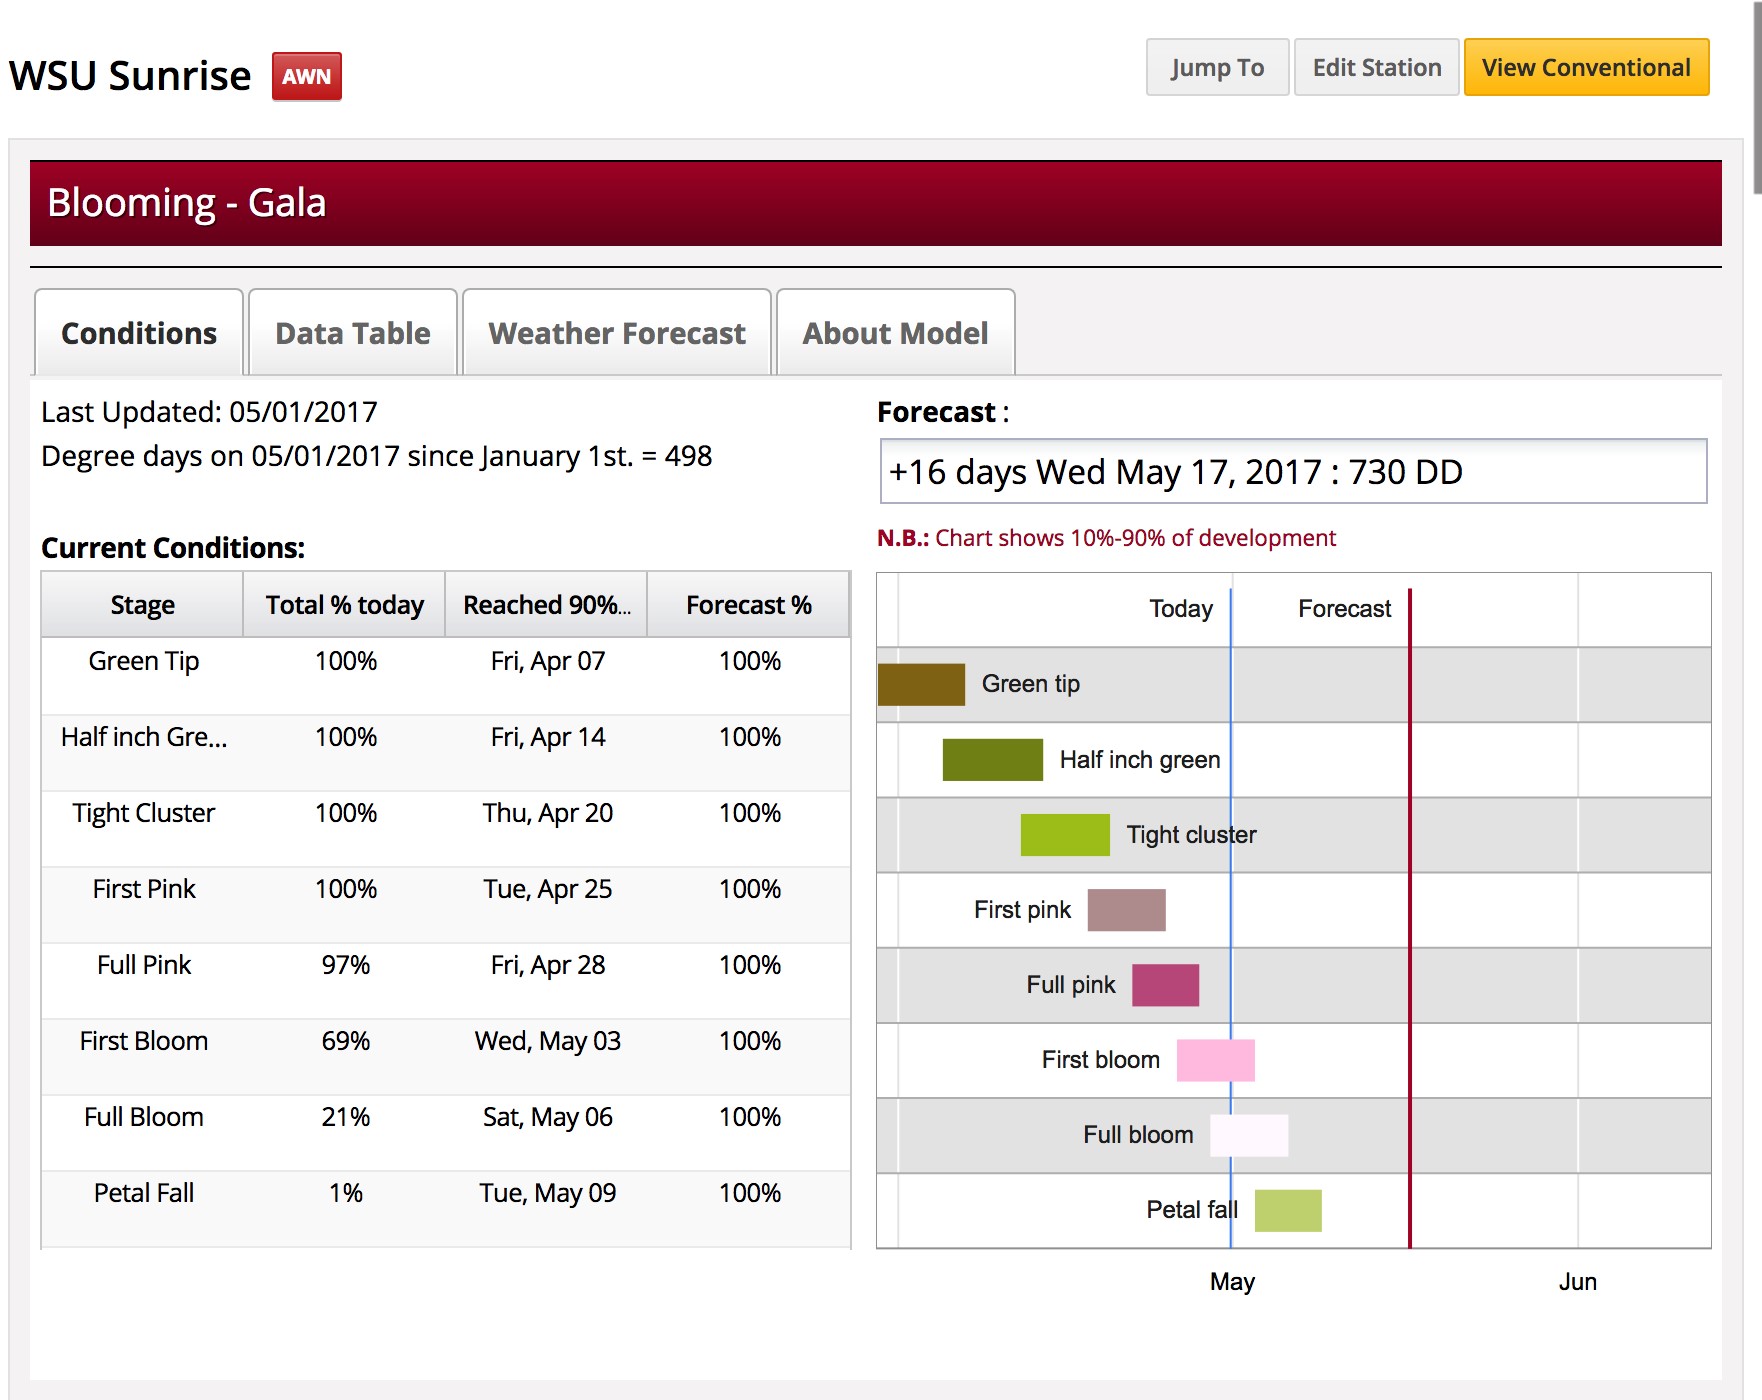
Flower phenology model.
The flower phenology model has eight stages from green-tip to petal fall. It shows the phenology at all these stages as a function of heat units with good predictability from degree days. The data was collected by the Washington Tree Fruit Extension Team by researchers at WSU TFREC and WTFRC. This model predicts the onset and completion of each stage, which helps time certain management activities.
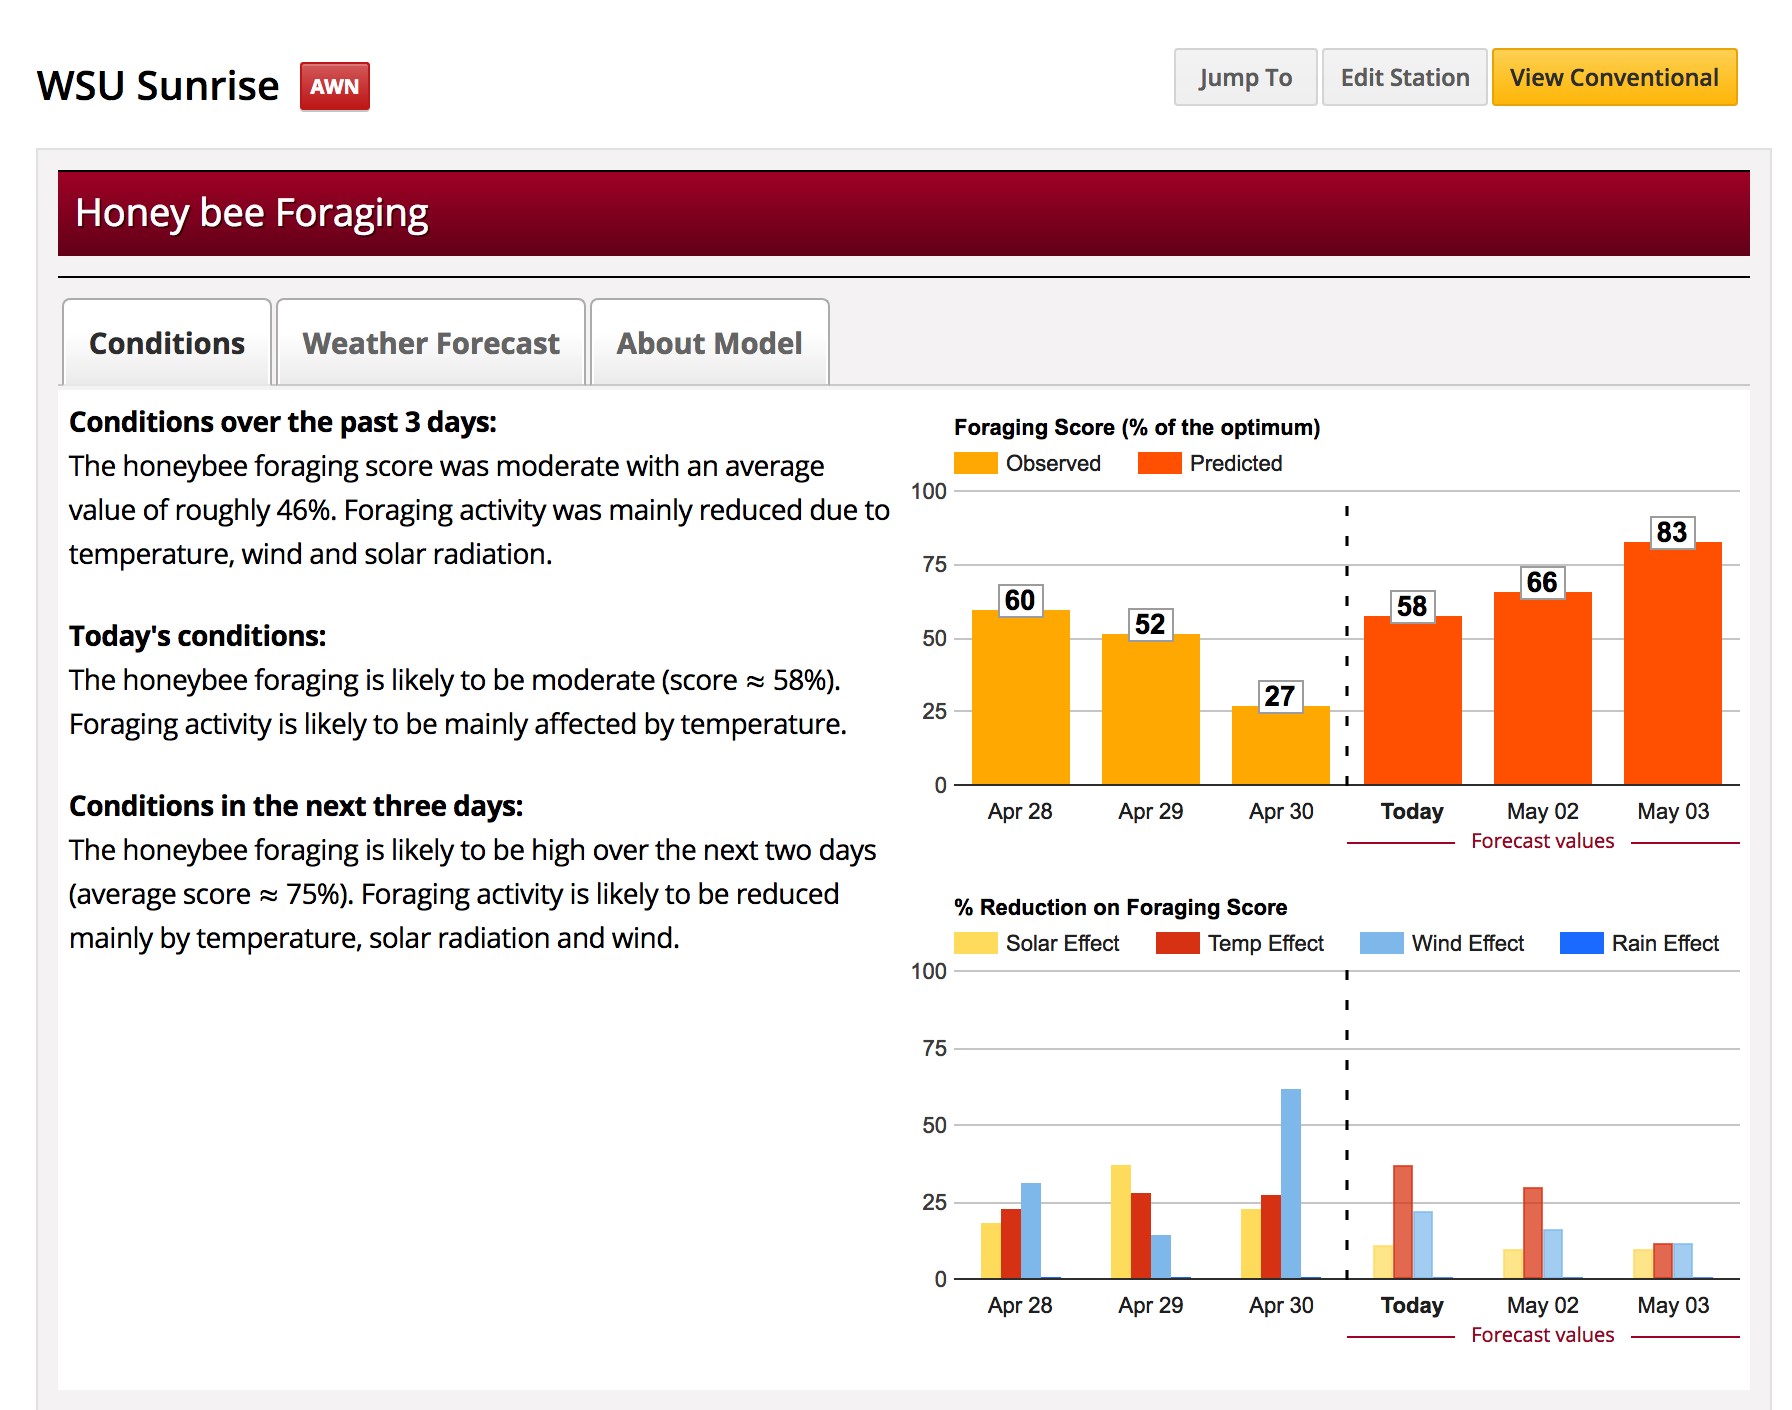
Honey Bee foraging.
This model was developed by Dr. Gloria DeGrandi-Hoffman, head of the USDA Carl Hayden Bee Lab in Tucson, AZ and adapted to Washington conditions by researchers at WSU TFREC and WTFRC. It predicts bee foraging activity based on temperature, wind speed, rain and solar radiation. Remember that honeybees don’t like to forage at low temperatures or in windy or rainy conditions. On brighter days they are more active. The daily foraging score reflects how active the bees are relative to optimal conditions. The model also indicates which conditions lower bee foraging activity.
Fruit Growth
The fruit growth model shows fruit size as a proportion of the final fruit size. It does not show exactly how big fruit will be, because crop load will affect final fruit size. By predicting fruit size as a proportion of final fruit size the model is able to take crop load out of the equation and correlate fruit growth to degree days. Growers can measure 40-50 fruit at the appropriate time, after 1440 DD, and estimate the final fruit size distribution by multiplying measured sized with a size factor.
Apple Scab model
The apple scab model has been updated to include a low inoculum and high inoculum setting. In central Washington, conditions are best described with the low inoculum model. In the west and eastern Washington, where it is wetter, the high inoculum model is more appropriate. The updated model provides more information about rain events and accumulated wetness hours before an infection might be triggered.
In order to access these new models in the WSU Decision Aid System sign up here https://www.decisionaid.systems/ . For current users go to my account, edit stations and check the box for the new models in each station’s settings.
Contact
 Ute Chambers
Decision Aid System Coordinator
(509) 663-8181
uchambers@wsu.edu
