Written by Achour Amiri, Assistant Professor, Plant Pathology and Emran M. Ali, Research Associate
Many fungal pathogens cause decay on apple with significant economic losses for packers. The Washington industry is familiar with pathogens like blue mold, gray mold and bull’s eye rot, but other pathogens, known as the “crabapple disease complex”, Speck rot and Sphaeropsis rot, have emerged in recent years. We conducted a statewide survey from February to June, 2016 on fruit harvested in 2015 on 160 grower lots from 10 different counties to provide a comprehensive and accurate assessment on the relative importance of the postharvest threats.
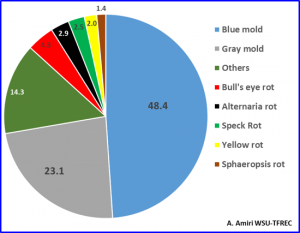
Results in Figure 1 indicate that blue and gray molds account for almost 72% of total decay, with blue mold causing 48%. Blue mold was detected in 157 of the 160 lots surveyed versus 132 lots for gray mold. Usually only one of these two pathogens was predominant in a single grower lot. Bull’s eye rot was found in 52 lots at frequencies ranging from 1 to 75%, whereas the statewide frequency was 4.3%. The frequency of Speck rot and Sphaeropsis rot was 2.5 and 1.4%, respectively. Additional minor pathogens included Alternaria rot (2.9%) and the newly reported yellow rot (2%). Other minor or unidentified pathogens accounted for 14.3% of total decay.

Geographic distribution
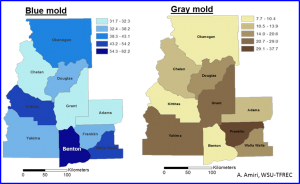
Blue mold frequency ranged from 31.7% to 62.2% versus 7.7 to 37.7% for gray mold in the 10 different counties surveyed (Figure 2). Blue mold was more frequent in Benton, Walla Walla and Kittitas and Okanogan counties whereas lower frequencies were found in Chelan, Grant and Adams counties. Gray mold was predominant in Franklin, Yakima and Grant counties, whereas lower frequencies were in Benton, Kittitas and Okanogan (Figure 2).

Impact on disease management and future trends
The prevalence of different pathogens may vary from one season to another, however, blue and gray molds will remain the two major threats for pome fruit storage. As seen in this survey, variability between packinghouses across different counties is expected and while differences in the number of lots surveyed per county may account for this variability, different postharvest practices implemented in different packinghouses may have a greater impact on blue mold compared to gray mold. Future efforts should focus on improving sanitation practices and evaluation of the impact of early inoculum size on blue mold development in addition to improving fungicide spray at harvest. For gray mold, preharvest practices and potential microclimates occurring in different growing regions may have more impact on disease pressure. Developing predictive tools for the gray mold fungus at earlier stages in the orchard would improve gray mold management pre and postharvest.
The frequency of other pathogens such as Speck and Sphaeropsis rots has decreased significantly compared to when these two pathogens were first described in the state. It is possible that improved management practices, including pruning and appropriate fungicide sprays, have helped reduce the impact of these minor pathogens. However, continuous monitoring and improved detection methods of such pathogens will be needed to help keep them under observation.
Contact
Assistant Professor
Plant Pathology
509-663-8181 ext 268
