Authors: Robert Orpet, Chris McCullough, Molly Sayles and Louie Nottingham; WSU Entomology. March 14, 2022
The Nottingham lab at WSU-TFREC is monitoring pear pests at seven commercial locations in the Wenatchee Valley in addition to the WSU research center orchard (‘Sunrise’) near Rock Island (Figure 1). At each location, one block follows our phenology-based IPM guidelines and another block follows standard conventional management. We are also monitoring organically managed blocks at three of the locations. All blocks contain mostly Anjou and Bartlett trees planted >50 years ago, except for Rock Island, which was planted in 2007.
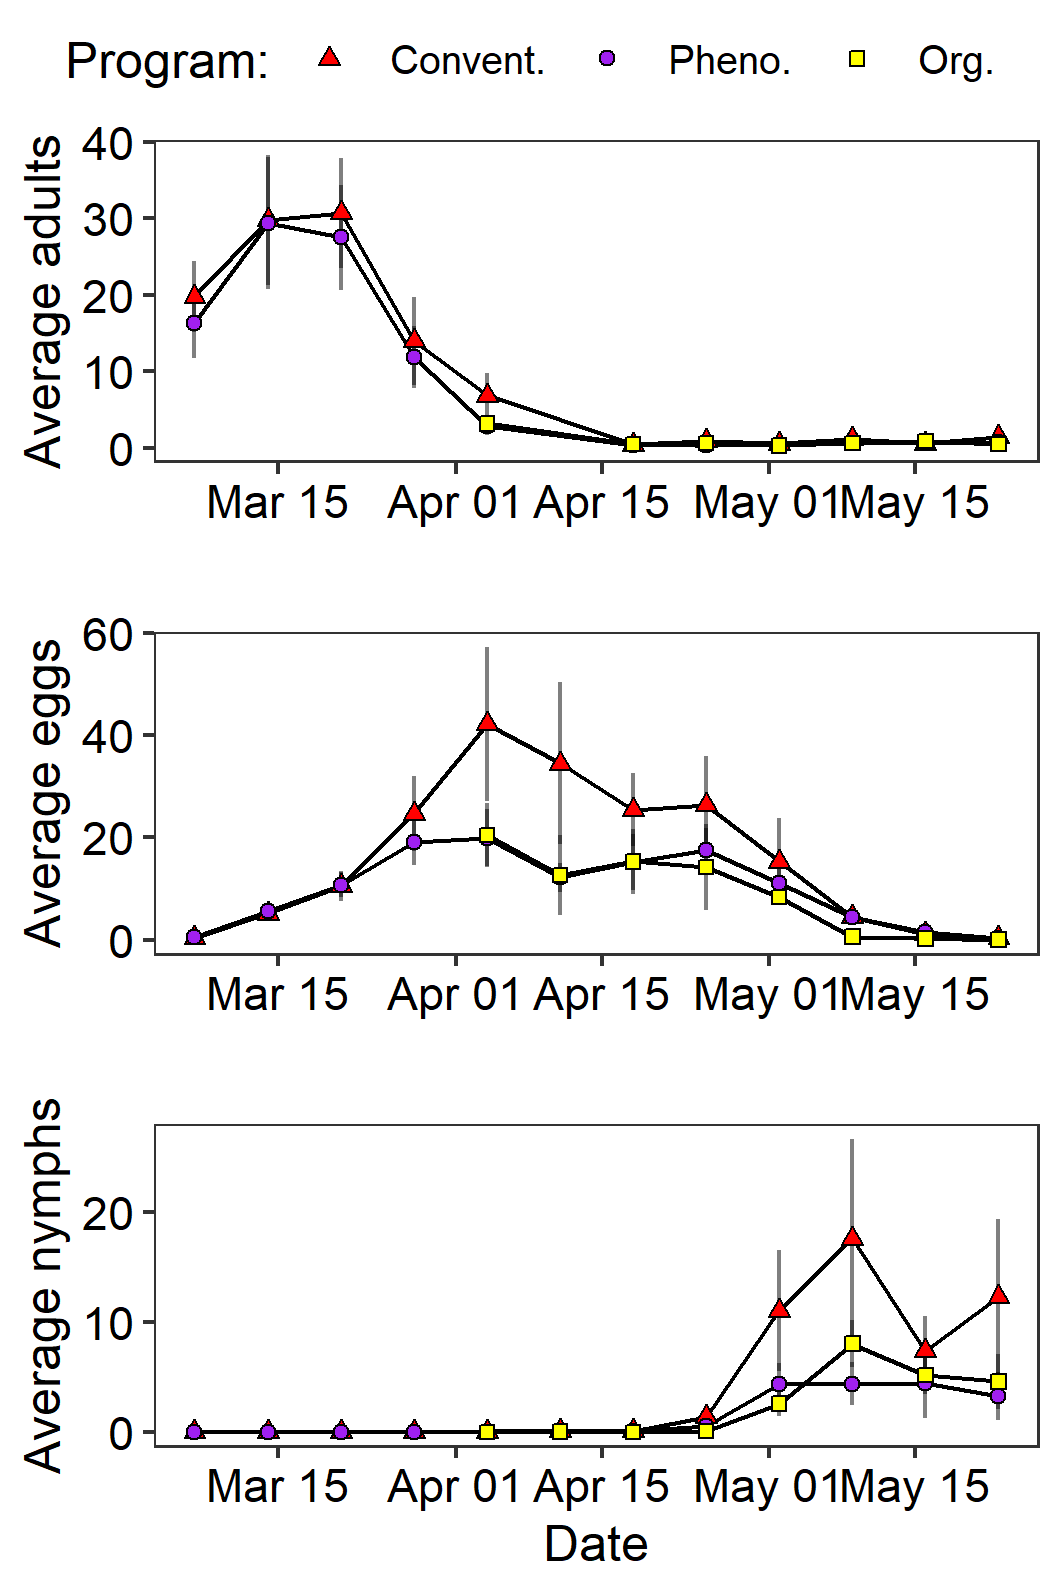
A summary of pear psylla adult, egg, and nymphs across sites is in Figure 2 (Summer) and Figures 3-4 (Spring), and data per site in are in Tables 1–6.
How we Sample
We sample pear psylla adults (Table 1) and natural enemies (Table 4) with beat tray taps. In spring, we collect buds to monitor psylla eggs and nymphs. In summer through fall, we collect leaves to monitor psylla eggs (Table 2) and nymphs (Table 3), mites (Table 5), and earwigs (Table 6).

For the Week of October 31
Thank you to everyone who attended our pear psylla field day and special thanks to Matt McDevitt for providing his orchard for the event. We had a great discussion about experiences with soft programs and using the phenology model. We know the timing was tight during Anjou harvest, but we hope to see you again at future events.
Announcements:
- We are still gathering some spray records and scheduling interviews if we have not yet this season.
- Save the date – WSU Extension is hosting a Pear IPM Intensive day Dec 14 with a slate of expert presenters and activities https://treefruit.wsu.edu/event/pear-ipm-intensive/
 Pear psylla degree-days and phenology:

- At all sites, we are the end of the third generation of pear psylla and past the limits of the phenology model. A partial fourth generation of eggs and nymphs will be produced, and these will die once leaves drop. A mix of life stages are currently present due to overlap with the third generation.
- New adults being produced are mainly winterforms that will overwinter in and around pear orchards.
Management guidelines:
- Spray season is over, but full phenology-based management guidelines (https://treefruit.wsu.edu/crop-protection/psylla-phenology-model) and a 2-page summary (https://s3.us-west-2.amazonaws.com/treefruit.wsu.edu/wp-content/uploads/2022/02/24171655/PDD-2022-Recs-and-Timings.pdf) are available online. We welcome any feedback
Scouting Report:
- Only pear psylla adult and natural enemy numbers were updated this week because leaves were too crinkly to check for eggs and nymphs on the leaf brush machine.
- Winterform psylla adult numbers increased even more in the last two weeks (note the scale is up to 100 on Figure 2 below).
- Conventional sites have extremely high counts; you can hear the rustle of adults as you walk in the sticky orchards.
- Natural enemies are disappearing from tray tap counts as they are finding shelter to overwinter.
- Site-specific graphs of pear psylla abundance are posted on the project webpage if you would like to see the data for your orchards.
Summer Sampling (May 30 through present)

Site Specific Scouting Graphs
(each site will open in a new page)
| Site 1 – Rock Island | Site 2 – Monitor | Site 3 – Cashmere | Site 4 – Dryden |
| Site 5 – Dryden | Site 6 – Peshastin | Site 7 – Hwy 97 | Site 8 – Leavenworth |
Summer Sampling (May 30 through present)
Psylla Adults Per Tray Tap (Summer)
Table 1. Pear psylla adults per tray tap paired orchards (C = conventional, P = Phenology-based IPM, O = organic). Dates represent the week of the sample. Cells with “–” indicate no sample due to site inaccessibility or re-entry intervals.
| PP adults/tray | 8/29 | 9/5 | 9/19 | 10/3 | 10/17 | |
| Rock Island 1 | C | 0.6 | 2.3 | 10 | 19.1 | 44.8 |
| P | 0.2 | 0.08 | 0.6 | 0.4 | 2.4 | |
| Monitor 2 | C | 9.7 | 8.9 | 11.9 | 11.1 | 82.9 |
| P | 2.4 | 1.8 | 1.3 | 0.8 | 9.4 | |
| Cashmere 3 | C | 2.4 | 6.3 | 7.6 | 51.4 | 98.9 |
| P | 1.9 | 0.5 | 0.4 | 1.8 | 5.2 | |
| O | 3 | 0.5 | 0.3 | 3 | 5 | |
| Dryden 4 | C | 2.3 | 6.5 | 14.4 | 63.4 | 107.2 |
| P | 3.9 | 5.06 | 11.02 | 7.3 | 74.4 | |
| Dryden 5 | C | 14 | 23.4 | 21.5 | 68.9 | 235.2 |
| P | 3.2 | 5.1 | 3.6 | 14 | 55.2 | |
| O | 3.7 | 1.2 | 2.7 | 9.08 | 26.08 | |
| Peshastin 6 | C | 0.7 | 2 | 7.8 | 32.08 | 55.8 |
| P | 2 | 1.5 | 1 | 0.8 | 2.2 | |
| O | 1.9 | 1.3 | 0.6 | 0.4 | 0.9 | |
| Highway 97 7 | C | 2.4 | 7.6 | 22.04 | 106.7 | 167.8 |
| P | 0.4 | 0.2 | 0.4 | 0.1 | 1.4 | |
| Leavenworth 8 | C | 2.6 | 7.6 | 16.04 | 28.8 | 72.2 |
| P | 8 | 10.1 | 18.4 | 29.8 | 77.7 |
Psylla Eggs per Leaf (Summer)
Table 2. Pear psylla eggs per leaf paired orchards (C = conventional, P = phenology-based IPM, O = organic). Dates represent the week of the sample. Cells with “–” indicate no sample due to site inaccessibility or re-entry intervals.
| PP eggs/leaf | 8/22 | 8/29 | 9/5 | 9/19 | 10/3 | |
| Rock Island 1 | C | 0.02 | 0.3 | 0.1 | 0.02 | 0 |
| P | 0.2 | 0.1 | 0 | 0 | 0 | |
| Monitor 2 | C | 0.8 | 1.4 | 3.9 | 4.4 | 0.1 |
| P | 0.4 | 0.7 | 0.4 | 0.3 | 0.04 | |
| Cashmere 3 | C | 0.4 | 0.2 | 0.6 | 0.5 | 0.08 |
| P | 0 | 0.8 | 0 | 0.08 | 0.1 | |
| O | 0.1 | 0.6 | 0.2 | 0.1 | 0 | |
| Dryden 4 | C | 0.1 | 1.1 | 1.4 | 0.4 | 0.2 |
| P | 0.8 | 0.7 | 0.8 | 0.4 | 0.2 | |
| Dryden 5 | C | 0.4 | 0.2 | 1 | 0.7 | 0.1 |
| P | 0.3 | 0.1 | 1.3 | 0.2 | 0.02 | |
| O | 0.3 | 0.1 | 0.2 | 0.02 | 0.1 | |
| Peshastin 6 | C | 0.3 | 0.3 | 0.2 | 0.1 | 0.2 |
| P | 0.6 | 0.1 | 0 | 0.1 | 0.1 | |
| O | 1.5 | 0.2 | 0 | 0.1 | 0.06 | |
| Highway 97 7 | C | 1.8 | 0.1 | 0.1 | 0.1 | 0.02 |
| P | 0.1 | 0.1 | 0.2 | 0 | 0.02 | |
| Leavenworth 8 | C | 0.2 | 0 | 0.7 | 0.2 | 0.02 |
| P | 0.4 | 0 | 0.5 | 0.2 | 0 |
Psylla Nymphs per Leaf (Summer)
Table 3. Pear psylla nymphs per leaf paired orchards (C = conventional, P = phenology-based IPM, O = organic). Dates represent the week of the sample. Cells with “–” indicate no sample due to site inaccessibility or re-entry intervals.
| PP nymphs/leaf | 8/22 | 8/29 | 9/5 | 9/19 | 10/3 | |
| Rock Island 1 | C | 0.3 | 0.5 | 1.2 | 0.8 | 0.3 |
| P | 0.4 | 0.2 | 0.2 | 0.1 | 0 | |
| Monitor 2 | C | 2.4 | 1.7 | 3.3 | 9.5 | 1.6 |
| P | 2.3 | 0.5 | 0.7 | 1.08 | 0.3 | |
| Cashmere 3 | C | 0.8 | 0.3 | 0.9 | 0.9 | 1 |
| P | 0.8 | 0.1 | 0.2 | 0.3 | 0.2 | |
| O | 2.2 | 0.3 | 0.9 | 0.3 | 0.2 | |
| Dryden 4 | C | 1.5 | 0.5 | 0.7 | 1.9 | 1.9 |
| P | 0.5 | 1.3 | 2 | 2.06 | 1.3 | |
| Dryden 5 | C | 0.6 | 1.8 | 5.01 | 0.9 | 1.4 |
| P | 0.3 | 0.1 | 0.6 | 0.07 | 0.5 | |
| O | 0.2 | 0.1 | 0.3 | 0.2 | 0.1 | |
| Peshastin 6 | C | 0.5 | 0 | 1.01 | 0.7 | 0.5 |
| P | 2.4 | 0 | 0.4 | 0.3 | 0.1 | |
| O | 0.4 | 0.2 | 0.6 | 0.2 | 0.08 | |
| Highway 97 7 | C | 2.1 | 1.5 | 0.5 | 4.4 | 1.08 |
| P | 0.1 | 0.1 | 0.06 | 0.06 | 0.2 | |
| Leavenworth 8 | C | 2.6 | 3.4 | 2.9 | 0.8 | 0.6 |
| P | 3.2 | 2.9 | 4.06 | 1.9 | 0.4 |
Natural Enemies (Summer)
Table 4. Natural enemies (Deraeocoris nymphs and adults, Trechnites wasps, Camplylomma nymphs and adults, and green lacewings) per 25 trays at paired orchards (C = conventional, P = phenology-based IPM, O = organic). Dates represent the week of the sample. Cells with “–” indicate no sample due to site inaccessibility or re-entry intervals.
| NEs/tray | 8/29 | 9/5 | 9/19 | 10/3 | 10/17 | |
| Rock Island 1 | C | 0.1 | 0.4 | 0.2 | 0.04 | 0.2 |
| P | 0.2 | 0.6 | 0.04 | 0.04 | 0 | |
| Monitor 2 | C | 0.2 | 0.3 | 0.7 | 0.4 | 0.2 |
| P | 0.6 | 0.7 | 0.2 | 0.4 | 0.3 | |
| Cashmere 3 | C | 0 | 0 | 0.02 | 0 | 0 |
| P | 0.4 | 0.6 | 0.7 | 0.5 | 0.2 | |
| O | 0.6 | 0.5 | 0.7 | 0.5 | 0.08 | |
| Dryden 4 | C | 0 | 0 | 0 | 0 | 0 |
| P | 0 | 0 | 0.04 | 0 | 0 | |
| Dryden 5 | C | 0.1 | 0.2 | 0.1 | 0.5 | 0.3 |
| P | 0.1 | 0.06 | 0 | 0 | 0 | |
| O | 0.4 | 0.4 | 0.9 | 0.2 | 0.04 | |
| Peshastin 6 | C | 0.2 | 0.08 | 0.1 | 0 | 0.04 |
| P | 0.9 | 1.04 | 0.9 | 0.1 | 0 | |
| O | 1.4 | 1.2 | 1.1 | 0.2 | 0 | |
| Highway 97 7 | C | 0.1 | 0.08 | 0 | 0.08 | 0 |
| P | 0.6 | 0.6 | 1.1 | 0.2 | 0 | |
| Leavenworth 8 | C | 0 | 0.04 | 0 | 0 | 0 |
| P | 1 | 0.9 | 0.3 | 0.1 | 0.2 |
Mites (Summer)
Table 5. Total Two-spotted spider mites per leaf at paired orchards (C = conventional, P = phenology-based IPM, O = organic). Dates represent the week of the sample. Cells with “–” indicate no sample due to site inaccessibility or re-entry intervals.
| TSM/leaf | 8/22 | 8/29 | 9/5 | 9/19 | 10/3 | |
| Rock Island 1 | C | 0.02 | 0 | 0 | 0 | 0 |
| P | 0 | 0 | 0.03 | 0 | 0 | |
| Monitor 2 | C | 0 | 0.4 | 0.1 | 0.06 | 0 |
| P | 0 | 0.06 | 0.01 | 0 | 0 | |
| Cashmere 3 | C | 0 | 0 | 0.01 | 0.01 | 0 |
| P | 0.06 | 1 | 0.3 | 4.6 | 4.04 | |
| O | 0.4 | 0.7 | 0.5 | 2.2 | 0.3 | |
| Dryden 4 | C | 0.2 | 0.2 | 0.8 | 0.5 | 0.5 |
| P | 3.08 | 4.9 | 1.9 | 1 | 1 | |
| Dryden 5 | C | 0 | 0.1 | 2.2 | 0.1 | 1.5 |
| P | 0.04 | 0.02 | 0.4 | 0.8 | 1 | |
| O | 35 | 3.3 | 1.5 | 0 | 0.04 | |
| Peshastin 6 | C | 0.7 | 0 | 0.06 | 0.3 | 0.5 |
| P | 0.1 | 0 | 0.01 | 0.01 | 0 | |
| O | 0.4 | 0.02 | 0.7 | 0.6 | 0.1 | |
| Highway 97 7 | C | 0.04 | 0.06 | 0.02 | 0.06 | 0.06 |
| P | 0 | 0 | 0 | 0 | 0 | |
| Leavenworth 8 | C | 2.2 | 0.7 | 5 | 1.9 | 0.5 |
| P | 0 | 0 | 0.08 | 0.08 | 0.06 |
Earwigs (Summer)
Table 6. Total Earwigs per cardboard at paired orchards (C = conventional, P = phenology-based IPM, O = organic). Dates represent the week of the sample. Cells with “–” indicate no sample due to site inaccessibility or re-entry intervals.
| Earwigs | 7/4 | 8/5 | 9/5 | |
| Rock Island 1 | C | 1.0 | 1.75 | 1.8 |
| P | 36.8 | 7.8 | 24 | |
| Monitor 2 | C | 0 | 0 | 0 |
| P | 0 | 0 | 0 | |
| Cashmere 3 | C | 0 | 0 | 0 |
| P | 0.2 | 1.6 | 2.8 | |
| O | 0.2 | 0 | 1.0 | |
| Dryden 4 | C | 0 | 0 | 0 |
| P | 0 | 0 | 0 | |
| Dryden 5 | C | 0 | 0 | 0 |
| P | 0 | 0 | 0.2 | |
| O | 2.6 | 4.4 | 3.6 | |
| Peshastin 6 | C | 0 | 0 | * |
| P | 0 | 0 | * | |
| O | 0 | 0 | * | |
| Highway 97 7 | C | 0 | 0 | 0 |
| P | 0 | 0 | 0 | |
| Leavenworth 8 | C | 0.2 | 0.8 | 0.3 |
| P | 0 | 0.2 | 0 |
*site will be counted next week
Anjou Damage Assessment
Table 7. Anjou damage assessment: percentage fruit downgraded from pear psylla damage (C = conventional standard, P = phenology based IPM, O = organic). We inspected 100 fruit per orchard.
Average US 1: 86% conventional; 84% phenology; 66% organic
| Honeydew marking/CM | US1 | Fancy | 3rd Grade | Cull | Codling moth | |
| Rock Island 1 | C | 98 | 2 | 0 | 0 | 0 |
| P | 100 | 0 | 0 | 0 | 1 | |
| Monitor 2 | C | 88 | 12 | 0 | 0 | 0 |
| P | 97 | 3 | 0 | 0 | 0 | |
| Cashmere 3 | C | 96 | 4 | 0 | 0 | 0 |
| P | 87 | 12 | 1 | 0 | 0 | |
| O | 88 | 11 | 1 | 0 | 0 | |
| Dryden 4 | C | 92 | 8 | 0 | 0 | 0 |
| P | 79 | 21 | 0 | 0 | 0 | |
| Dryden 5 | C | 87 | 11 | 2 | 1 | 0 |
| P | 88 | 10 | 2 | 0 | 0 | |
| O | 84 | 16 | 0 | 0 | 0 | |
| Peshastin 6 | C | 94 | 6 | 0 | 0 | 0 |
| P | 79 | 21 | 0 | 0 | 0 | |
| O | 50 | 47 | 3 | 0 | 0 | |
| Highway 97 7 | C | 90 | 9 | 1 | 0 | 0 |
| P | 100 | 0 | 0 | 0 | 0 | |
| Leavenworth 8 | C | 94 | 6 | 0 | 0 | 0 |
| P | 82 | 18 | 0 | 0 | 0 |
Links
All data from the project are publicly stored
There is a sign-up link for these weekly updates you can feel free to share
Spring Sampling Summary (March through May)


Dr. Robert Orpet
Postdoctoral Research Associate
WSU Tree Fruit Research & Extension Center
1100 N Western Ave., Wenatchee, WA 98801
robert.orpet@wsu.edu

Dr. Chris McCullough
Postdoctoral Research Associate
WSU Tree Fruit Research & Extension Center
1100 N Western Ave., Wenatchee, WA 98801
christopher.t.mccul@wsu.edu

Dr. Louis Nottingham
Assistant Professor
WSU Tree Fruit Research & Extension Center
1100 N Western Ave., Wenatchee, WA 98801
louis.nottingham@wsu.edu
540-798-2044 (cell)

Molly Sayles
PhD student
WSU Tree Fruit Research & Extension Center
1100 N Western Ave., Wenatchee, WA 98801
molly.sayles@wsu.edu

Disclaimer:
Use pesticides with care. Apply them only to plants, animals, or sites listed on the labels. When mixing and applying pesticides, follow all label precautions to protect yourself and others around you. It is a violation of the law to disregard label directions. If pesticides are spilled on skin or clothing, remove clothing and wash skin thoroughly. Store pesticides in their original containers and keep them out of the reach of children, pets, and livestock.
YOU ARE REQUIRED BY LAW TO FOLLOW THE LABEL. It is a legal document. Always read the label before using any pesticide. You, the grower, are responsible for safe pesticide use. Trade (brand) names are provided for your reference only. No discrimination is intended, and other pesticides with the same active ingredient may be suitable. No endorsement is implied.
