Prepared by: Ines Hanrahan
Collaborators
Ines Hanrahan and Manoella, Washington Tree Fruit Research Commission;
Rob Blakey and Hannah Walters, Stemilt R&D;
Madison Schaefer and Glade Brosi, Storage Control Systems.
Goals
1) Determine the severity of stem punctures during picking and packing of WA 38.
2) Determine the utility of stem clipping.
3) Determine general storage performance, size and color distribution of bin-sized fruit lots following 6 month CA storage.
Experimental Design & Setup
Fruit
The Quincy location was picked by a commercial crew hired by Stemilt, under the general direction of Hannah Walters on October 13, 2017. The fruit was transported that same day to the Stemilt Research CA facilities to be drenched with Scholar at the commercial rate, treated with 1-MCP and stored until April 10, 2018, in a CA room (34°F, 1% CO2, 2% O2).
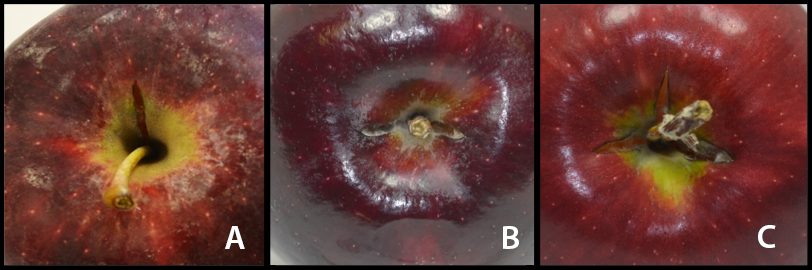
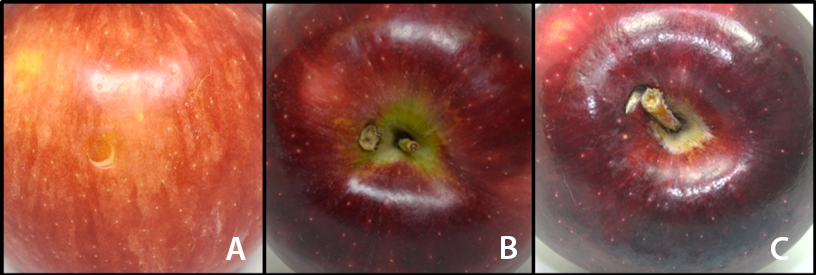
In April, we evaluated five bins each stem clipped and fruit picked with stems to determine the amount of stem punctures, spur punctures, stem bowl splitting and decay immediately after storage (examples shown Figures 1 and 2). We removed fruit with decay (1-2%) and fruit exhibiting multiple defects (1%) of interest. Next, we washed, waxed, graded, and packed fruit on a commercial line deploying the following simplified grading system: five quality grades (Premium 90-100% color, Premium 70-90% color, 2nd grade 50-70% color, 3rd grade 40-50% color, culls), and four size classes (56-64, 72-80, 88-100, 113-125). Data was analyzed using a 2-way ANOVA, t-test to separate means at P ≤ 0.05.
Results and Discussion
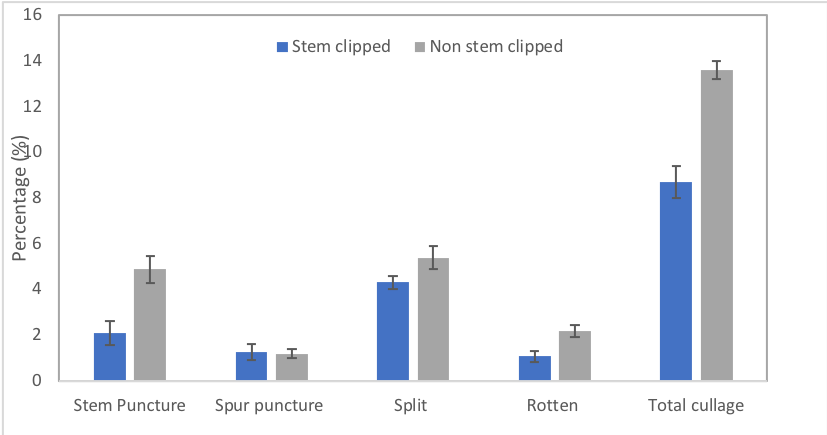
Stem punctures and utility of clipping
We observed a total of 18,397 pieces of fruit which equals 1,840 fruit per bin. The majority of fruit was deemed ‘clean’ in our evaluation (87/92% of fruit without stem punctures and clipped stems, respectively), i.e. absent of defects of interest. Fruit without stem clipping had significantly higher amounts of stem punctures, stem bowl splits, and decay when compared to fruit with clipped stems (Figure 3). The amount of stem clipped fruit with clipper damage was very low (10 fruit total or 0.1%, not shown). All fruit evaluated exhibited 1% of apples with more than one defect present, the majority of which were double stem bowl splits (not shown).
Semi-commercial packout
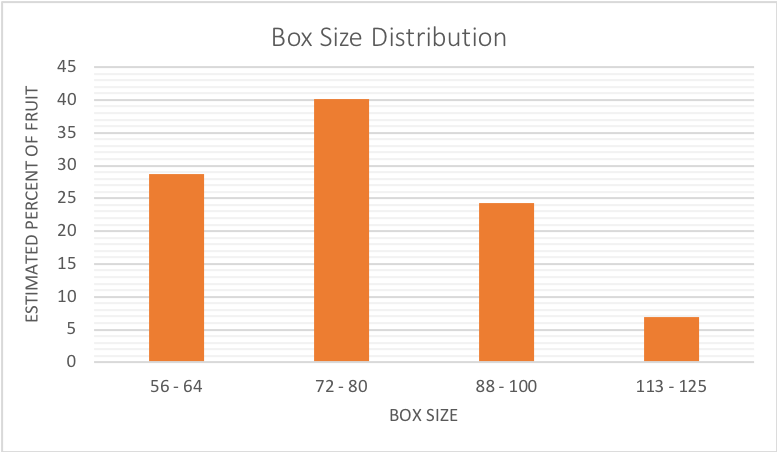
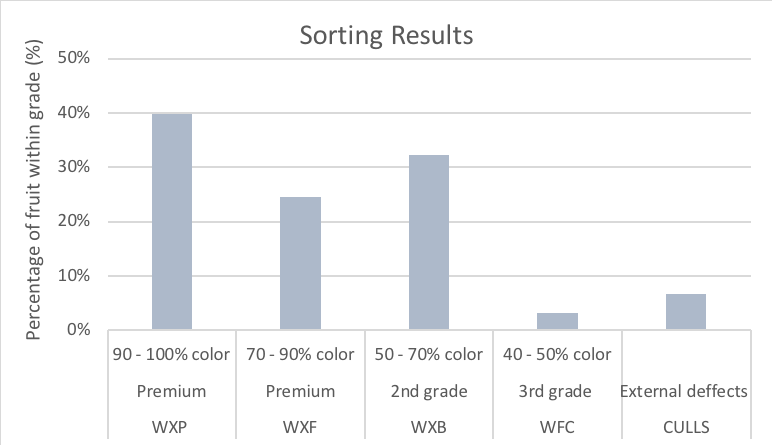
We ran fruit over a commercial packingline utilizing a simplified grading scheme and documented the process (Figure 4). Fruit was graded in four box sixes, and 40% of fruit was classified as size 72-80, followed by 29% of fruit in size 56-64, and 24% of fruit in size 88-100 (Figure 5). At the same time, fruit were separated by percent red color into five classes and culls included external defects, under color (<40% of dark red on fruit surface), irregular shape, and internal browning. Except for the external defects, all cull categories were zero (Figure 6). The results indicate that 10% of the fruit had less than 50% red color, while 65% of fruit had at least 70% color. After packing we observed a total of 7 new stem punctures (0.06%) and conclude that on this packingline and with the fruit ran as small lots of 5 bins each, a negligible amount of new punctures was incurred during packing.
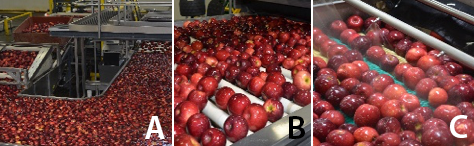
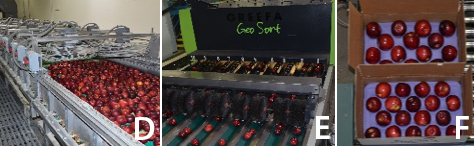
Fig. 4. General procedures of fruit washing (a-C), waxing (D), grading (E), and packing (F) at Stemilt.
Next, we analyzed our data to determine potential commercial implications of this data by including costs for clipping and weighing those against the additional losses of fruit due to punctures and additional decay. Our results are shown in Table 1. Based on this data set, stem clipping increased returns by 5%.
| Table 1: Costs of stem clipping versus loss of revenue due to stem punctures of fruit. | |||
|---|---|---|---|
| stem clipped | with stem | ||
| Harvest cost | per bin | $ 32.00 | $ 25.00 |
| 1 acre | $ 1,625.00 | $ 2,080.00 | |
| 40 acre | $ 83,200.00 | $ 65,000.00 | |
| FOB | per bin | $ 1,189.44 | $ 1,134.72 |
| 65 bins/acre | $ 77,313.60 | $ 73,756.80 | |
| 40 acre | $ 3,092,544.00 | $ 2,950,272.00 | |
| Returns (FOB-harvest cost) | per bin | $ 1,157.44 | $ 1,109.72 |
| 65 bins/acre | $ 75,233.60 | $ 71,676.80 | |
| 40 acre | $ 3,009,344.00 | $ 2,885,272.00 | |
Footnotes:
|
Conclusions and Future Plans
We conclude that stem clipping WA 38 decreased the amount of stem punctures from five to two percent, and it also decreased the amount of decay (50% less). Based on our economic analysis, stem clipping is feasible and leading to increased returns/acre in most situations. We cannot fully explain why stem clipping reduced the amount of stem bowl splitting, as this defect is thought to manifest in the field. It is possible that some splits open up in storage, but we are not aware of any research corroborating this idea. It is most likely that pickers excluded some fruit with stem bowl splits during harvest when clipping the stems.
We conclude that stem clipping may not be feasible (necessary) in all situations, but should be considered based on expected storage time, presence of stem bowl splits, and yield.
In general, WA 38 from Quincy in 2017 had a fair amount of fruit in the larger size categories (29% of 64 and larger) and a low amount of low colored fruit (10% below 50% dark red color). In addition, we determined there was an overall 5% stem bowl splits, and 1% spur punctures. As commercial harvest of this variety starts in 2019, both defects should be monitored closely as harvest approaches or during harvest. We believe that it is possible that different tree structures or rootstock combinations may lead to an altered propensity for those defects.
We do not plan to repeat this experiment in 2019.
Acknowledgments
We would like to acknowledge the assistance of the Stemilt packingline team and Enrique Garcia, members of the WTFRC team: Mackenzie Perrault, Blanca Ruiz, Monique Borba, Daniel Gleason, Cecilia Yiu, Sandy Stone, Rob Curtiss, Gerardo Garcia and former WSU student Corina Serban.
