Written by: Tianna Dupont and David Granatstein, WSU Extension. Updated: January 2020. Download PDF
Compost can help improve soil quality and nutrient, water, and pest regulation. High-quality soil holds water and nutrients like a sponge, slowly releasing them over time to meet tree needs. High-quality soil can also suppress pests and diseases that may attack plant roots. Proper consideration of compost quality and nutrient content are critical to achieving these benefits. This publication describes potential benefits from compost use as well as provides descriptions of compost quality and nutrient composition factors orchardists planning to use compost should consider.
What is Compost?
According to the USDA, “Composting is the controlled aerobic decomposition of organic matter by microorganisms into a stable, humus-like soil amendment” (Rynk 1992). The final composted material should have the following physical and odor qualities: unrecognizable original materials; dark brown to black; foreign matter and materials less than 1%; relatively porous, not compacted or hard; and no objectionable odors, but an “earthy” smell (Rynk 1992). High-quality compost should have:
- Moisture less than 60%;
- Organic matter not less than 40% (oven dried mass); and
- Carbon to nitrogen (C:N) ratio of less than 25:1 (showing the material is stable).
Depending on the intended use, materials that do not meet these requirements can provide benefits. For example, yard debris products with considerable woody material and high C:N may be suitable as a mulch but not for soil incorporation where immediate nutrient release is the goal.
Certified organic producers should know that compost must be made according to the criteria set out in § 205.203(c)(2) of the National Organic Standards (AMS/USDA). Manure-based materials not certified as compost are subject to pre-harvest interval requirements. This section of the regulation specifies that:
- The initial C:N ratio of the blended feedstocks must be between 25:1 and 40:1.
- The temperature must remain between 131 and 170°F for 3 days when an in-vessel or a static-aerated-pile system is used.
- The temperature must remain between 131 and 170°F for 15 days when a windrow composting system is used, during which period the windrow must be turned at least five times.
Check with your organic certifier to see which products have been reviewed for organic compliance in your area.
Compost Testing
Multiple certified testing laboratories are available to evaluate compost (see Appendix 2). Select a compost-specific analysis, not a soil test. A soil test analysis of a compost sample will provide inaccurate results.
Compost qualities to consider:
- Nutrient content. Nutrient content can be highly variable between composts and even among batches from the same supplier.
- Electrical conductivity (EC) and salts (Na). EC is an indicator of the salt level in the compost. However, it also relates to the nutrient content. Note: the units dS/m = mmhos/cm=mS/cm. Less than 0.5% salt (Na) is desirable.
- pH. Avoid high pH compost on soils above optimum pH (6.0 to 6.5 for tree fruit).
- NO3 vs NH4. Compost with more ammonium (NH4) is less mature. In some composts (e.g. chicken manure), the available N (NH4+NO3) makes up a considerable portion of total N and may need to be considered separately when doing N budgets.
- C:N. Compost with C:N ranges of 15:1 to 25:1 should not tie up N or result in excess loss to leaching orvolatization.
- Organic matter (OM). 50-60% OM indicates maturity. Very low OM often indicates contamination with soil.
- Bioassy. Occasionally compost may be contaminated with herbicide residual or sufficiently high enough salts or nutrients to reduce plant growth. An emergence test with a susceptible plant, such as watercress, helps to indicate risk.
- Pathogens. Salmonella and E. Coli levels can indicate levels of pathogens of potential human risk.
- Weeds. Most labs do not test for weed seed. Managers can evaluate weed seed presence by moistening a few cups of compost, placing in a warm area, and waiting two to four weeks and then observing the number of weeds which germinate.
Compost Can Improve Water Holding and Buffering Capacity
Compost, like many other types of high carbon inputs, can increase soil organic matter, and, consequently, the water holding capacity of soil. Organic matter tends to act like a sponge, holding water and nutrients in the soil and releasing them slowly over time. Soil scientists report that for every one percent of organic matter content, the soil can hold 16,500 gallons of plant-available water per acre of soil down to one foot deep (Hudson 1994).
Increased water holding is an important characteristic in the well-drained orchard soils of central Washington. In the middle of summer in central Washington an orchard may need three acre-inches of water per week to keep up with tree evapotranspiration needs. Water stress can lead to small-sized fruit and calcium disorders, like cork spot and bitter pit.
Surface application of high-carbon inputs, like compost, can also help with water retention. For example, in one study, Neilsen et al. (2003) found that mulching saved more than 50% on irrigation (Table 1). In another study, surface application of mulch decreased water depletion by 24% (Granatstein and Mullinix 2008). Note, mulch studies were generally done with low nutrient products like wood chips.
Table 1. Effect of mulching on water use in apple trees in lysimeter plots.
| Trunk diameter | H2O used/tree (L) | Irrigation saved by mulching (%) | |
| (mm) | non-mulched | mulched | |
| 25 | 1009 | 466 | 54% |
| 50 | 2427 | 2072 | 15% |
Fertility Inputs from Compost
Compost can be a good source of nutrients. Manure-based compost may contain twenty to eighty pounds of nitrogen and four to forty pounds of potassium (K20) per dry ton (Tables 2 and 3).
Table 2. Average compost nutrient levels.
| Parameter | Test Value | Lbs applied per Ton |
| Organic matter | 45% | 900 |
| Total Nitrogen | 1.5% | 29 |
| Phosphorus (P2O5) | 0.96% | 19 |
| Potassium (K20) | 1.1% | 22 |
| C:N | 17 | 22 |
| Based on 126 manure-based compost samples. All test values are based on percent dry weight. Data courtesy Penn State Ag Analytical Lab 2012. | ||
Table 3. Nutrient Content of Washington Composts.
| Chicken | Cow | Yard | ||
| OM% | 74-78 | 30-50 | 30-50 | |
| pH | 6.3-8.3 | 6.1-8.9 | 6.3-7.6 | |
| E.C. | mmho/cm | 25-30 | 7-25 | 2-13 |
| C:N | 10-38 | 10-32 | 13-23 | |
| Tot N | % | 1.1-4.2 | 0.9-1.9 | 0.8-2.0 |
| NO3-N | ppm | 162-2460 | 36-2081 | 8-1421 |
| NH4N | ppm | 3600-9780 | 16-306 | 17-50 |
| Tot P | % | 0.9-1.8 | 0.2-0.8 | 0.2-0.3 |
| Tot K | % | 0.6-2.5 | 0.3-1.4 | 0.4-1.1 |
| Ca | ppm | 3.0-5.5 | 1.1-2.5 | 1.1-1.5 |
| Mg | ppm | 0.4-0.7 | 0.5-1.0 | 0.4-0.5 |
| Zn | ppm | 142-516 | 73-271 | 143-207 |
| B | ppm | 29-59 | 61-242 | 59-62 |
| Cu | ppm | 33-930 | 37-96 | 26-80 |
| Based on three chicken manure-based composts, four cow manure based composts and three yard waste composts. Granatstein, 1996. | ||||
Keep in mind that the nutrient composition of compost can be highly variable depending on what feedstock is used and the time of year. Make sure to test your compost or request the most recent analysis from your supplier.
Feedstock (e.g., type of manure, woody debris, food processing waste) is the largest determinant of nutrient composition of the final compost. However, even between batches of the same type of compost, the content can vary. For example, here are nutrient values from several compost sources available in Washington (Table 4 and 5). Notice that nutrient content generally varies more between composts with different feedstocks than for composts from a similar feedstock.
Table 4. Nutrient availability in example Washington composts (lbs/ton).
| TotN | P2O5 | K2O | Ca | Mg | Na | S | B | Zn | Mn | Cu | Fe | |
| Royal Organics Compell1 | 7 | 20 | 50 | 54 | 11 | 4 | 6 | 0.04 | 0.21 | 0.51 | 0.06 | 32 |
| Royal Organics Classic2 | 5 | 12 | 24 | 34 | 9 | 3 | 4 | 0.04 | 0.26 | 0.63 | 0.07 | 28 |
| Royal Organics Mint | 13 | 30 | 34 | 54 | 19 | 2 | 9 | 0.06 | 0.13 | 0.32 | 0.05 | 9 |
| Rexius2 | 5 | 12 | 22 | 40 | 9 | 2 | 2 | 0.04 | 0.38 | 1.14 | 0.09 | 30 |
| Eko | 4 | 38 | 13 | 32 | 10 | 1 | 0.4 | 0.04 | 0.03 | 0.56 | 0.28 | 13 |
| Ava Gro3 | 5 | 42 | 71 | ND | ND | ND | ND | ND | ND | ND | ND | ND |
| Natural Selections | 6 | 36 | 34 | 79 | 14 | 8 | 7 | 0.07 | 0.33 | 0.81 | 0.10 | 33 |
| Nutrients available year 1 (lbs) per ton of compost (dry weight). Assuming an availability factor of 0.15 for nitrogen. 1manure based; 2Greenwaste; 3broiler. Based on compost tests for Washington composts analyzed at certified labs collected by DuPont 2015. Note: These results will vary from year to year and batch to batch. ND = not determined. |
||||||||||||
On average, compost contains 1–3% total nitrogen (about 30–60 lb/ton). However, nitrogen in compost is not all available in the year managers apply it. Composts with higher total nitrogen generally have higher nitrogen mineralization in the year of application, resulting in more available nitrogen. The mineralization rate will also vary with compost maturity. Generally, between 5 and 20% will be mineralized per year. For mature compost, an estimated 15% will be available the year after application, and 10% the following two years. After three years, the compost will continue to contribute as part of the organic matter component of the soil. A conservative assumption is a credit of 20 lb per acre of available nitrogen for every percent organic matter greater than 2%. For less mature compost (e.g., chicken manure material, which is high in ammonium), 20% or more may be available the first year. Due to high volatization and leaching potential, immediate incorporation of materials that are not fully composted is critical.
The Oregon State University Organic Fertilizer Calculator (Andrews et al. 2012) provides a fairly accurate estimate of nitrogen mineralization from various inputs that takes into account the carbon to nitrogen ratio of the product and the dry matter content. For example, see Table 5 below, availability varies from 5-10% based on compost dry weight and 2-22% based on wet weight.
Table 5. Potentially available nitrogen from example composts calculated with OSU Organic Calculator.
| C:N | % Tot N | PAN4 (lb N/100 lb) |
Available N (lb/Ton) | |||
| dry basis | as is basis | dry basis | as is basis | as is basis | ||
| Royal Organics Compell1 | 10:1 | 2.4 | 2.2 | 0.10 | 0.22 | 11 |
| Royal Organics Classic2 | 14:1 | 1.7 | 1.3 | 0.10 | 0.17 | 6 |
| Royal Organics Mint | 8:1 | 4.2 | 2.7 | 0.10 | 0.27 | 23 |
| Rexius2 | NR | 1.7 | 0.7 | 0.05 | 0.04 | 1 |
| Eko | 18:1 | 1.4 | 0.7 | 0.05 | 0.03 | 1 |
| Ava Gro3 | NR | 1.6 | 1.2 | 0.05 | 0.02 | 1 |
| Natural Selections | NR | 2.1 | 1.7 | 0.10 | 0.17 | 7 |
| Nitrogen available the year of compost application over the entire season. 1manure based; 2Greenwaste;3broiler; 4PAN = Potentially Available Nitrogen; NR = not rated. Based on example compost tests for Washington composts collected by DuPont, 2015. Calculations from Oregon State University Fertilizer Calculator. |
||||||
Despite considerable benefits, compost use presents some practical challenges. For example, the ratio of nutrients in compost often do not match the ratio called for by soil test recommendations or represented by crop removal. When using compost as the primary nitrogen source, it is common to end up applying more phosphorus and potassium than is needed. If this is repeated over multiple years, soil phosphorus levels can become elevated to where they exceed the phosphorus index threshold (an indicator of environmental risk) for the site (the phosphorus index is calculated based on erosion potential, run-off potential, fertilizer type, soil phosphorus level, fertilizer application method, and fertilizer application rate).1. Soil potassium levels may become elevated to where potassium interferes with uptake of other nutrients, such as calcium. Consider using compost to meet phosphorus requirements and then supplementing with another nitrogen source to meet the full nitrogen need. See Example 1 below for example calculations.
Example 1: Nitrogen-Based Compost Applications Leading to Excess Soil Phosphorus.
A manager receives a nitrogen recommendation for mature apples of 60 lb N per acre. The manager plans to use chicken manure compost with an analysis of 3-1.6-2.5. The compost test shows that 1% of the 3% total N is available ammonium and nitrate. Two tons of compost will approximately meet the 60 lb nitrogen requirement and also add 64 lb P and 100 lb K. A 50 bin apple crop will remove an estimated 26 lb of N, 2 lb P, and 56 lb K in the fruit (Neilsen and Neilsen 2003). By providing the target amount of available N, the compost application is adding far more phosphorus per acre more than is removed by the crop, and repeated applications will clearly lead to phosphorus buildup. (Table 6)
Available N from ammonium and nitrate =
4,000 lbs (compost) × 0.01 (%NH4,NO3) = 40 lbs N
Available N from mineralization =
4000 lbs compost × 0.03 (% organic N) × 0.15 (availability yr 1) = 18 lbs N
Table 6. Calculation nitrogen-based compost applications can lead to excess phosphorus.
| Nitrogen (N) lb/acre |
Phosphorus (P) lb/acre |
Potassium (K) lb/acre |
|
| 1. Nutrient needs | 60 | 2 | 56 |
| 2. Subtract this year’s application two tons chicken manure compost | 58 | 64 | 100 |
| 3. Balance | 2 | -62 | -44 |
Compost Use and Soil Salinity
Some composts have high salt content that can damage plant roots. The Electrical Conductivity (EC) test is the best indicator of this. For example, several chicken manure composts had EC of 25–30 mmho/cm, compared with yard debris composts of 2–13 mmho/cm. A high EC compost can be used if it is diluted in enough soil and not placed right in contact with tree roots. Some of the EC in chicken compost is from the nutrient salts, such as potassium, calcium, and magnesium. A compost with a large portion of the EC from sodium (greater than 0.5% of dry weight) is not desirable. By calculating the effect of compost EC on the soil it is to be mixed with, the risk of root damage can be estimated. (See the Example 2 Compost Effect on Soil EC below for more information.)
Example 2. Compost Effect on Soil EC
Consider a chicken manure compost with an EC of 25 mmho/cm and 25% moisture. Add 26 tons per acre of wet compost (20 tons dry, a high rate) to a soil with an EC of 1.0 mmho/cm and incorporate to a six-inch depth. Assume the weight of the top six inches of soil to be two million pounds.
Use a weighted average to calculate:
| EC compost X | compost weight | + EC soil X | soil weight | |
| weight compost + soil | weight compost + soil | |||
| 25 mmho/cm X | 400,000 lb | + 1 mmho/cm X | 2,000,000 lb | = 1.5 mmho/cm |
| 2,040,000 lb | 2,040,000 lb | |||
Apple and pear will have begun to have yield reduction with a soil EC above 1.7 mmho/cm (USDA-SCS. 1985). Thus, the proposed compost application could be made with minimal risk. Repeated applications should not be made without soil testing to ensure salts have not been accumulating.
Compost Potential to Impact Replant Disease
In general soils with higher organic matter as a result of compost or other carbon inputs have larger more active soil biota. Beneficial soil biota populations can reduce the potential for infection from plant pathogens. However, the impacts of compost have been variable.
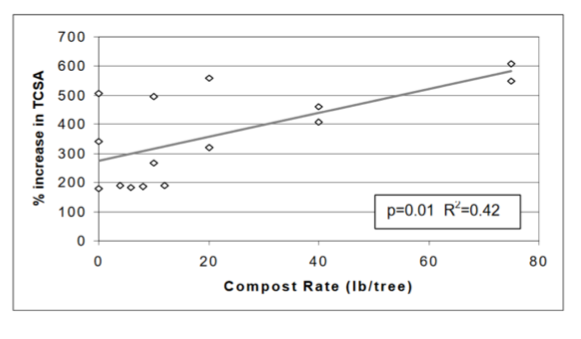
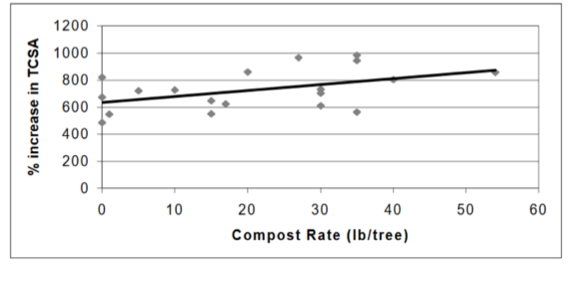
In a series of replicated compost trials across a number of farms with differing replant conditions, trees generally responded to increasing compost rate in replant sites (Figure 1) and sites with no history of apple (Figure 2). Growth improvements from high compost applications were more dramatic (600% increase) for replant sites than for new orchard sites (300% increase) (Granatstein and Dauer 1999).
In a more recent study Watson et al. (2017), an agricultural waste compost (1.2% N; C:N 15:1) was compared with soil fumigation, surface bark mulch, compost plus bark mulch, and an untreated control on a recently removed apple orchard. Sweet cherry trees were planted and monitored for two years, along with changes in the soil. Tree growth for treatments with compost or mulch alone were not different than the untreated control and less than fumigation, but tree growth for the treatment with compost and mulch was higher than the control (and equal to fumigation). Compost and mulch suppressed root lesion nematodes in tree roots relative to the control. On-going experiments continue to examine compost effects on replant disease.
Summary
Choice of an appropriate compost is based on the desired outcome. In general, composts are best regarded as a soil amendment for longer-term soil improvement. They can be a source of nutrients in the growing season of application, but particularly for nitrogen, compost may not be the best source (or should be used in combination with other inputs) because their nutrient balance is different than plant needs. A C:N ratio of less than 20:1 will indicate high probability for mineralization and thus available nutrients. A ratio of approximately 15:1 is desirable for nitrogen release. A compost being used more for building soil organic matter (from the carbon in the compost) should contain low levels of nutrients so that high levels of carbon can be added without creating nutrient imbalances or excesses. Yard debris compost, particularly, with woody feedstocks, are an example.
Footnotes
1The phosphorus index is calculated based on erosion potential, run-off potential, fertilizer type, soil phosphorus level, fertilizer application method, and fertilizer application rate.
Appendix 1
Do you have sufficient nitrogen to meet your crop needs?
Scenario A:
Assume a 75 bin per acre crop goal on dwarf trees where crop needs are: 66 N, 11 P, 121 K (Cheng and Raba 2009). Assume a compost with an analysis of 32 lb total N/T, 42 lbs P/T and 71 lbs K/T (analysis based on wet weight). If a manager applies 3 T/A of this compost will they supply the crop with sufficient N? Use a 15% mineralization rate for this example.
| 32 lbs N | X | 3 Ton compost | = | 96 lbs N applied | ||
| Ton compost | A | A | ||||
| 96 lb N applied | X | 0.15 lb N available year 1 | = | 14 lb N available year 1 | ||
| A | lb N applied | A | ||||
Table 7. Calculation table demonstrating nitrogen, phosphorus, and potassium inputs and resulting balance.
| Nitrogen (N) lbs/A |
Phosphorus (P) lbs/A |
Potassium (K) lbs/A |
|
| 1. Nutrient needs | 66 | 11 | 121 |
| 2. This year’s application | 14 | 126 | 213 |
| 3. Balance | 52 | -115 | -92 |
In this example the manager did not supply sufficient nitrogen for the crop this year based on compost applications. Additionally, phosphorus and potassium inputs exceeded crop needs.
Scenario B:
If it is not your first year using compost, you likely need to also consider contributions from previous applications. In this case, we will consider a field with a history of compost applications. Assume soil organic matter of 3.0%. Assume that 3 ton/acre of compost was applied last year as well as this year. Assume crop needs and compost analysis from Scenario A (See Table 8).
1. Assume the needs based on the example crop needs.
2a. Assume a credit of 20 lb/A of available N for every % OM over 2%.
| 3.0% OM – 2.0% OM = 1.0 X | 20 lb N | X | 20 lb available N |
| A | A |
2.c. Calculate a credit for nitrogen mineralizing from the previous year’s compost applications.
| 32 lbs N | X | 3 Ton compost | = | 93 lb N applied | X | 0.10 lb N avaliable year 2 | = | 0 lb N available year 2 |
| Ton compost | A | A | lb N applied | A |
3. Add credits from inputs.
4. Subtract credits from needs.
5. Calculate the input from this year’s compost application.
| 32 lbs N | X | 3 Ton compost | = | 96 lbs N applied | ||
| Ton compost | A | A | ||||
| 96 lb N applied | X | 0.15 lb N available year 1 | = | 14 lb N available year 1 | ||
| A | lb N applied | A | ||||
6. Calculate the balance.
In this example, once the soil had received multiple OM inputs over time, moderate compost applications could meet crop needs. However, phosphorus and potassium inputs exceeded crop needs. Calculations like these are still estimates but should get you closer to accurate predictions.
Table 8. Nitrogen, phosphorus, and potassium inputs and example calculations.
| Nitrogen (N) lbs/A |
Phosphorus (P) lbs/A |
Potassium (K) lbs/A |
|
| 1. Nutrient needs based on soil tissue test and crop goals. | 66 | 11 | 121 |
| 2. Credits from revious season | |||
| a. Soil organic matter | 20 | ||
| b. Manure | |||
| c. Compost | 10 | ||
| d. Prior legume cover crop | |||
| e. Prior leguminous crop | |||
| 3. Total credits (add a + b + c + d + c) | 30 | ||
| 4. Additional needed (1 minus 3) | 27 | 11 | 21 |
| 5. This year’s application (source 1) | 14 | 126 | 213 |
| 6. Balance | 13 | -115 | -92 |
Appendix 2
Compost Testing Services
A complete listing of analytical labs
- A&L Western Laboratories, Inc. Portland, OR
- Ag Analytical Services Lab Penn State University. University Park, PA. (814) 863-0841
- Central Testing Laboratory Ltd. Winnipeg, MB Canada.
- Colorado Analytical Laboratories, Inc. Brighton, CO.
- Soiltest Farm Consultants. Moses Lake, WA. (509) 765-1622.
Appendix 3
Compost Suppliers
For a more complete listing visit https://data.wa.gov/w/58r6-eukc/mncn-zj8q. Listing is to provide a resource for growers and does not imply recommendation of use.
- Ava Gro. Granger, WA. Contact Gary Dixon (509) 864-2601.
- Barr-tech. Spokane, WA. Feedstocks include yard waste, food waste, and municipal bio-waste. Contact Scott Deatherage (509) 939-6063
- Biowest Ag Solutions. Richland, WA. Contact (509) 572-0034.
- Corfe’s Premium Chicken Manure Compost. Armstrong, British Columbia. (250) 546-9732
- Eko Compost. available through Northwest Wholesale
- Nature’s Nutrients. Armstrong, British Columbia. (250) 550-4100.
- Natural Selection Farms. Sunnyside, WA.(509) 837-3501, Natural Selection Farms email contact.
- Organix, Inc.Walla Walla, WA. (509) 527-0526
- Pacific Clean.Spokane, WA. (509) 455-5477
- Rexius Forest By Products Inc. Eugene, OR. (541) 335-8008, Rexius email contact.
- Royal Organics. Royal City, WA (509)554-3885, Royal Organics email contact.
References and Further Reading
- BC Agricultural Composting Handbook. 1996. edited by British Columbia Ministry of Agriculture and Food. Abbotsford, BC.
- Soil fertility and crop nutrient management practice standard. AMS/USDA. 7 CFR 205.203
- Andrews, N., D. Sullivan, J. Julian, and K. Pool. 2012. Organic Fertilizer Calculator. Oregon State University.
- Cheng, L. L., and R. Raba. 2009. Accumulation of macro- and micronutrients and nitrogen demand-supply relationship of ‘Gala’/’Malling 26’ apple trees grown in sand culture. Journal of the American Society for Horticultural Science134 (1):3-13.
- Granatstein, D. 1996. Summary of Ten Washington Composts. Washington State University.
- Granatstein, D. , and P. Dauer. 1999. Compost effects on apple tree growth, parts 1 and 2. In Compost Connection newletters. Wenatchee, WA. Washington State University.
- Granatstein, D., and K. Mullinix. 2008. Mulching Options for Northwest Organic and Conventional Orchards. Hortscience43:45-50.
- Hudson, B. D. 1994. Soil organic matter and available water capacity. Journal of Soil and Water Conservation49 (2):189-194.
- Neilsen, G. , and D. Neilsen. 2003. Nutritional requirements of apple. In Apple: Botany, Production, and Uses., edited by D.C. Ferree and I.J. Warrington, 267-302. Cambridge, MA.: CABI Publishing.
- Neilsen, G. H., E. J. Hogue, T. Forge, and D. Neilsen. 2003. Surface application of mulches and biosolids affect orchard soil properties after 7 years. Canadian Journal of Soil Science83 (1):131-137.
- Penn State Ag Analytical Lab. 2012. PennState College of Agricultural Sciences.
- Rynk, R. 1992. On Farm Composting Handbook NRAES-54. Ithaca, NY: Natural Resource Agriculture and Engineering Service (NRAES).
- USDA-SCS. 1985. Salinity tolerance. In State of Washington Irrigation Guide. Spokane WA.
- Watson, T.T., L.M. Nelson, D. Neilsen, G.H. Neilsen, and T.A. Forge. 2017. Soil amendments influence Pratylenchus penetrans populations, beneficial rhizosphere microorganisms, and growth of newly planted sweet cherry. Applied Soil Ecology 118:212-220.
