Summary by Tianna DuPont, WSU Extension. Model created by Tim Smith, WSU Professor Emeritus. March 6, 2020.
The Cougar Blight Model estimates the risk of fire blight infection during bloom by calculating temperature risk values which consider hourly temperatures and Erwinia amylovora bacterial growth rates and predicts potential infection events based on blossom wetting. Considerable updates were made to the model in 2010 with additional updates in 2019.
Erwinia amylovora the bacterial causal agent of fire blight grows best at warm temperatures and can infect flowers when wetting occurs. E. amylovora has minimal growth below 50°F. As temperatures increase populations reproduce more quickly with slow growth below 70°F, and optimal growth at 80°F (Pusey and Curry, 2004). Above 95°F reproduction slows and population growth is minimal. At warm temperatures E. amylovora populations reach high enough levels to cause infections (estimated at more than 100,000 cells per flower). However, in order to infect, moisture from rain or dew must wash bacteria down into the floral cup where the bacteria can enter the flower through the nectarthodes and cause infection. Blossom wetting alone does not cause fire blight but when populations are high even light wetting from dew or mist from irrigation sprinklers can be sufficient to wash bacteria into the floral cup where it can infect flowers. Fire blight can also infect through wounds in young-tender tissue causing shoot blight.
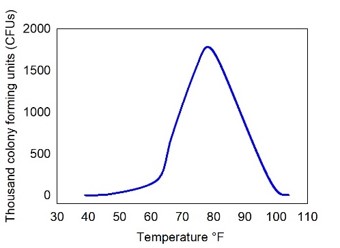
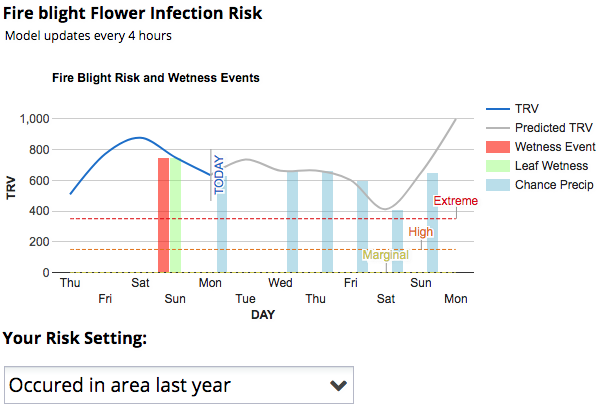
The Cougar Blight Model estimates the risk of blossom blight infections using a temperature risk value and predicted blossom wetting events. Hourly temperature risk values are calculated using the bacterial growth curve for E. amylovora (figure 1) with a lower threshold of 50°F and an upper threshold of 95°F with additional modifications to better fit the physical effect that high temperatures have on flowers (figure 2) (Smith and Pusey, 2010). Note that the lower threshold was reduced from 60°F to 50°F in 2010. The model uses average hourly Ag Weathernet reported temperatures to determine risk values. (Note this is an update from 2010 where values were calculated from daily vs hourly temperatures). Hourly risk values are accumulated for 4 days (96 hrs; the estimated time a flower remains susceptible to infection) to equal a total risk value (TRV). The four-day total risk

values used as thresholds depend on the fire blight history of the orchard. Risk thresholds are reported based on three scenarios which simulate low, medium and high inoculum. If growers select ‘no fire blight in the orchard last year’ in the decision support system (DAS) risk is considered marginal from 0-399 TRV, high from 400-799 TRV and extreme above 800 TRV. This scenario used to be common in the Washington and Oregon but with multiple years of high infection in 2017 and 2018 is unlikely to be accurate for most growers currently. If growers select ‘occurred in the area last year’ risk is considered marginal from 0-149 TRV, high from 150-349 TRV and extreme above 350 TRV. This should be the default setting in areas with a history of fire blight problems. If growers select fire blight is ‘now active in the area’ risk is considered marginal below 79 TRV, high from 80-199 TRV and extreme above 200 TRV. This scenario assumes a live canker or new blight strike is currently nearby. It is critical to choose the correct setting to more accurately predict risk. Blossom wetting is estimated based on 15-min weather data from Ag Weathernet where a tenth of an inch or more is considered rain and relative humidity over 80% is considered dew. If a two-or more hour period is wet then a ‘wetness event’ is estimated.
The risk thresholds in this model were created based on observations of more than 30 years of infection events in Washington and Oregon. These thresholds should not be treated as absolute numbers. Consider them guidelines to help inform your decision.
The Cougarblight Model is available for periods when flowers are commonly present on trees (March 11 to Jun 20; Aug 20 to Sept 3). Only use for periods when you have flowers on your trees. For a downloadable excel sheet to calculate risk values using farm weather data download CougarBlight2019ver8 . The previous version using daily versus hourly temperatures is CougarBlight2010EZver5_1F.
References
Pusey, P.L., Curry, E.A., 2004. Temperature and pomaceous flower age related to colonization by Erwinia amylovora and antagonists.
Smith, T.J., Pusey, P.L., 2010. CougarBlight 2010 ver. 5.0, a Significant Update of the CougarBlight Fire Blight Infection Risk Mode. Acta Hort, 331-338.
Contact
 Tianna DuPont, WSU Extension
Regional Specialist Tree Fruit
509-293-8758
tianna.dupont@wsu.edu
Treefruit.wsu.edu articles may only be republished with prior author permission © Washington State University. Republished articles with permission must include: “Originally published by Washington State Tree Fruit Extension Fruit Matters at treefruit.wsu.edu” along with author(s) name, and a link to the original article.
