Written by Bernardita Sallato, Updated March 2026
Analyzing your orchard’s soil chemistry is a useful approach for determining nutrient availability in soils and detecting physical or chemical limitations. However, it remains a tool that can only estimate nutrient availability, and requires a good understanding of nutrient – water – soil – plant relations to interpret the results appropriately.
Why sample soils?
Sampling soils for physical, chemical analyses, or biological testing can be utilized for different purposes. Most commonly soil tests are useful to:
- Identify soil variability and nutrient availability prior to planting
- Develop a nutrient management plan based on soil nutrient supply
- Diagnose a condition in the orchard (low vigor, chlorosis, poor quality)
- Evaluate changes over time or compare between practices
- Plan a new orchard soil amendments and irrigation design
Regardless of the objective, soil sampling is the first key process for successful interpretation and should be carefully planned.
Timing
Soil samples can be collected at any time depending on the objective, but is preferable to collect samples at the same time each year to evaluate trends. Fall testing allows time for planning and slow release soil amendments, while spring tests reflects nutrient availability for early uptake, which is of particular importance for mobile nutrients such as nitrogen (N), sulfate (SO4) and boron (B). Mobility of nutrients in the soil depends on the soil texture and cation exchange capacity (CEC) of the soil. In low CEC soils or coarse textured, cations: calcium (Ca), magnesium (Mg) and potassium (K) can move faster and leach, thus their availability will vary throughout the season. In heavier soils, such as silt loam or clay soils, most nutrients are stable throughout the season and the timing of sampling becomes less relevant.
For highly mobile nutrients like ammonia (NH4) or nitrate (NO3), soil tests aren’t a good predictors of seasonal availability, reflecting a temporal condition. If the purpose of the soil test is to assess nitrogen availability, soil organic matter is a better predictor. To estimate N supply with organic matter levels, visit tree fruit nutrition page
Additional precautions: Avoid collecting samples right after the application of fertilizer or soil amendments, an irrigation event or excessively dry soil.
Defining a sampling area
In every orchard thought should be given to where samples are collected. The accuracy and representation of the values obtained from the test, are thus determined by the sampling process. Physical, chemical, and biological conditions in the soil are influenced by many factors, each of which should be considered when defining the sampling area. The most important to consider are: soil type (sandy, rocky, silty, etc.), cultivar and rootstock, tree age, irrigation system, drainage, slope, management history, and tree vigor.
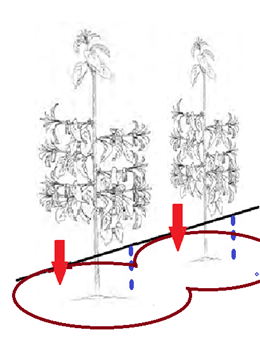
For example, Figure 1 reflect two distinct scenarios. The image on the left is a 10-acre tree orchard block with similar soil type and vigor, which can be considered a homogeneous block. In contrast, the image on the right is a 7-acre block with distinct variability in tree vigor, with a slope that drains water to the middle of the block. Here, the orchard in the left is a uniform management area and one sample, composed of 15 to 20 subsamples would likely reflect accurately the condition of the entire block. The orchard in the right, should be separated in at least three areas to accurately reflect the soil condition, regardless of being one management area.

Many Washington tree fruit growing soils are highly heterogeneous, in which dividing the block in sub-units could become expensive and impractical. For example, soils with basalt rock at variable depth, a caliche (calcium carbonate CaCO3) layer, sandy or rocky strips and others. Under these highly variable conditions, is better to prioritize the sampling units rather than combining them, by selecting the most representative, or the most limiting that requires attention.
If the goal is to diagnose a problem in the orchard, the sampling strategy is slightly different. Here, the sampling should be done in the problematic area; chlorotic trees, low or excessive vigor, reduce yield, etc. and compare with a healthier area in the same block.
Sample depth and placement
Sampling depth should considering where the feeder roots are growing in a given site. In tree fruit, most of the feeder roots are in the upper two feet of soil. However, rootstock and soil limitations can influence the depth of the feeder roots (Figure 2). Thus, to make sure the sampling depth represents the area where most feeder roots are located, dig a couple of soil pits between trees and determine the actual root depth.

If the feeder roots are concentrated in a deeper soil layer (below two feet),
sampling each layer can inform on limiting conditions that are preventing roots to grow in the upper layers of the soil (Figure 2). Avoid sampling right below the drip emitter, and it is preferable to collect from the edge of the weed strip. Collect samples from over the planting row and prevent collecting samples from the middle of the rows or cover cropped area.
If the purpose of the soil test is to identify nutrient movement throughout the soil profile or leaching of mobile nutrients such as nitrate, sulfate or boron, samples should be collected from deeper soil layers, below the root depth.
Sampling
There are several tools to collect samples (Figure 4). Soil augers are designed with different shapes for different types of soils.

Soil drill bits can also be used for samples between 8 to 12 inches deep, varying in length and width. A shovel or spade can also be used however it requires an additional step (Figure 4). Other helpful tools include plastic bags, a clean bucket and markers for labeling.
Regardless of the tool selected, remove the first inch of soil litter prior to sampling, by scratch the soil surface with the shovel or foot before collecting the sub-sample. If utilizing a shovel, remove the sides of the soil sampled, leaving one rectangular core.
Each sub sample core should be collected into a clean bucket. Depending on the soil tests required, the amount of sample needed can vary, and it is important to check with the testing laboratory. For most standard chemical tests, two cups of the mixed soil would be sufficient. Mix all sub-samples well, collect two cups of the composite sample and place in a plastic bag. Label each sample properly with at least the orchard name, block, and cultivar. Some laboratories will provide sampling bags, with preprinted label to fill out. Keep record of the list of samples for future reference. Place each sample in a box for shipping and send as soon as possible to your chosen laboratory. Soils can be kept for long period of time prior to testing, which greatly depends on the test. If testing for N, samples should be sent as soon as possible.
Laboratory test
Soil chemical and physical analyses for agriculture purposes utilize analytical methods that will indicate nutrient availability for plant uptake, differing from methods utilized in environmental or construction studies that evaluate total elements. Several methods are currently available by private laboratories that utilize different extraction methods. In WSU we recommend the standard methods described in Table 1.
Table 1. Recommended soil test levels and testing methods for tree fruit. Source: Sallato et al.,2019
| Soil test | Unit | Low | Optimal | Excessive | Methoda |
|---|---|---|---|---|---|
| pH | – | < 5.0 | 6.0 – 7.5 | > 8.0 | 1:1 /CaCl |
| E.C paste | mmhos/cm | – | < 2.6 | > 4 | Paste |
| E.C 1:2.5 or 1:1 | mmhos/cm | – | < 0.5 | > 1 | 1:1 |
| P-Olsenb | ppm | < 10 | 15 – 40 | > 50 | NaHCO3 |
| Potassium (K) | ppm | < 120 | 150 – 250 | > 300 | NH4OAc |
| Potassium (K) | meq/100g | < 0.3 | 0.4 – 0.6 | > 0.7 | NH4OAc |
| Calcium (Ca) | meq/100g | < 3.0 | 4.1 – 20 | NH4OAc | |
| Magnesium (Mg) | meq/100g | < 0.5 | 0.5 – 2.5 | > 2.5 | NH4OAc |
| Sodium (Na) | meq/100g | < 0.5 | > 0.5 | NH4OAc | |
| Boron (B) | ppm | < 1.0 | 1.0 – 1.5 | > 1.5 | CaCl 0,01 mol/L |
| Sulfur (S)c | ppm | < 4 | 9 – 20 | > 20 | Ca3(PO4)2 |
| Zinc (Zn) | ppm | < 0.25 | 0.6 – 1.0 | DTPA | |
| Copper (Cu) | ppm | < 0.1 | 0.6 – 1.0 | > 20 | DTPA |
| Manganese (Mn) | ppm | 1 – 5 | > 50 | DTPA | |
| Iron (Fe)d | ppm | > 4.5 | – | – | DTPA |
| ppm | 0.11 – 0.20 | – | DTPA |
Note: mg/kg = ppm. ppm = meq/100g*MW/charge*10.
a Methods: Plant, Soil and Water Reference Methods for the Western Region. 2005. R. G. Gavlak, D. A. Horneck, and R. O. Miller.
b P-Olsen is recommended to mildly acid to alkaline soils of eastern Washington. Gavlak et al 2005.
c The method has a detection limit of 2.0 mg kg-1 (dry basis) and is generally reproducible to within ± 15%. Better to look at in tissue analysis.
d Soil analyses for Fe, does not correlate well with Fe availability.
In eastern Washington, soil pH and organic matter are fundamental for interpreting nutrient availability. High pH levels are closely related to free lime (CaCO3) in the soil, which derives from layers of CaCO3 that vary in depth and thickness. High levels of CaCO3 are also reflected in high extractable Ca (above 15 meq/100g) and high effervescence, some testing laboratories can test the percent CaCO3 in soils, which is useful to determine the amount of acid needed to reduce pH in the soils.
Soil texture is one of the most important physical characteristics as it affects nutrient movement and adsorption and should be tested at least once in the orchard lifetime, ideally at different soil depths. For example, sandy soils (over 50% of sand mineral) do not retain or adsorb nutrients as much a clay or silt soils, so most mobile elements are less stable through the growing season and the analysis will only represent a moment in time.
Macronutrients are required in large amounts in tree fruit, and for N, P and K, the demand, or crop extraction can normally exceed the natural soil supply. As indicated above, N is highly mobile in the soil and its measurement in the soil reflect a moment in time, which eventually will change depending on environmental temperature, irrigation, drainage, microbiological activity, pH, among other factors. In contrast, phosphorous (P) is very stable in the soil (non-mobile). In Washington, P levels are generally low in uncropped soils, or soils cropped for many years without P corrections. The P- Olsen test gives a good representation of P availability in soils. Extractable potassium (K), calcium (Ca) and magnesium (Mg) is a good indicator of cation availability and utilizes ammonium acetate (NH4OAc) as extractant which has been extensively used by soil scientist to guide fertilization practices in tree fruit.
In alkaline soils (pH above 7.5), micronutrients such as iron (Fe), zinc (Zn), cupper (Cu), manganese (Mn) and boron (B) can be precipitated and become unavailable for plant uptake. Given the low quantity needed to supply plant demand, their management has been accomplished effectively through foliar sprays, based on tissue analyses. Thus, soil testing for micronutrients is not as relevant in alkaline soils.
Another relevant characteristic of soils in eastern WA is soil salinity, well represented with the electric conductivity test (E.C.) in soil solution or paste. If the E.C is high (above 0.5 mmhos/cm in solution or 2.6 mmhos/cm in paste), saturated past test of salts will allow us to identify which salts are present, and guide mitigation practices. Important salts in WA soils are sodium (Na), bicarbonate (HCO3), sulfate (SO4) which is generally associated to gypsum (CaSO4) applications and, to a lesser extent, chloride (Cl).
Agricultural laboratories certified by the Soil Science Society of America (SSSA) that perform the recommended methods can be found at naptprogram.org. When working with a lab outside of your region, make sure to select tests appropriate for your soil type.
Interpreting soil test requires and integrated analysis of soil – plant – water relations. Soil testing should be complemented with tissue samples and detailed observation of the orchard vigor, historical management and tree growth response to external factors, including water, heat, pest and disease.
For information on nutrient management for tree fruit:
Sallato, B., T. DuPont and D. Granatstein. 2019. Tree Fruit Soil Fertility and Plant Nutrition in Cropping Orchards in Central Washington.
Melissa Fery, Jeff Choate and Elizabeth Murphy. 2018. A Guide to Collecting Soil Samples for Farms and Gardens.
WSU Organic Farming Systems and Nutrient Management
Natural Resources Conservation Service
Contact
Bernardita Sallato
WSU Tree Fruit Extension
b.sallato@wsu.edu
