Prepared by: Ines Hanrahan
Collaborators
Ines Hanrahan and Manoella, Washington Tree Fruit Research Commission;
Rob Blakey and Hannah Walters, Stemilt R&D;
Madison Schaefer and Glade Brosi, Storage Control Systems.
Goals
1) Determine the respiration rate of WA 38.
2) Determine the low oxygen limit (LOL) of WA 38.
Experimental Design & Setup
Fruit
Sunrise: The fruit at the Sunrise orchard received two preharvest fungicide applications of Pristine applied on September 25 and again on October 2, at a rate of 8.5 ounces/acre. On October 13, 2017 fruit was picked at this location. None of the fruit were stem clipped at harvest and WA 38 were strip picked and separated by rootstock (M9 vs. G41). Only fruit from plots with the G41 rootstock were used for this experiment. Care was taken to avoid placing fruit with open wounds (bird pecks, splits, rot) into the harvest bins. In addition, other fruit deemed culls/second grade were removed from the bins. This included severe russet, under-sized fruit, off shape, insect damage, severe sunburn, for example.
Quincy: The fruit at the Quincy location was picked on October 13, 2017, by a commercial crew hired by Stemilt, under the general direction of Hannah Walters. Fruit was transported that same day to the Stemilt Research CA facilities to be drenched with Scholar at the commercial rate.
Storage
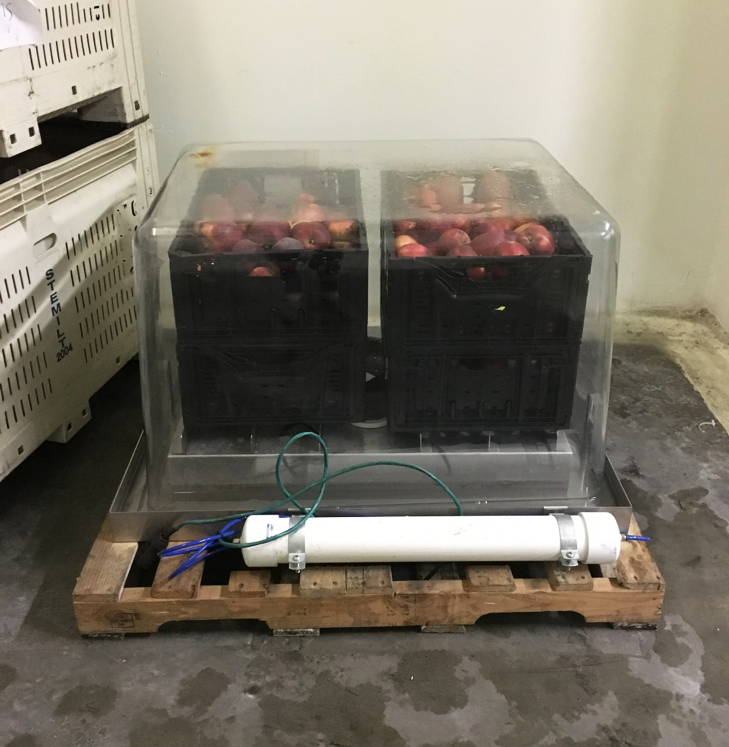
From each location, 231/265 pieces of fruit (Sunrise and Quincy, respectively) were placed into four plastic crates (one crate = one replication) and stored until March 2018 within two SafePods supplied by Storage Control Systems in a research CA room at a temperature of 33°F, with 1% carbon dioxide, and 2% oxygen (Figure 1). Fruit respiration rate (ml CO2/kg/hr = milliliters of carbon dioxide produced/kilogram apples/hour) was monitored continuously, and the respiratory quotient (RQ, carbon dioxide produced/oxygen consumed) was determined. In addition, each SafePod was challenged five/six times (Pod1 and Pod2, respectively) by a multistep oxygen reduction (0.04% increments/~2.25 hours) to determine the low oxygen limit (LOL) of the fruit. The challenge was concluded and oxygen concentrations returned to 2% when the RQ started to increase above 1.2 (indicating the LOL was reached).
Fruit Quality
Common fruit quality parameters were determined prior to and at the end of the storage experiment. We also evaluated the amount of stem bowl splits, stem and/or other punctures, and decay after storage.
Results and Discussion
Fruit Quality
Table 1 shows the results of fruit quality determination at harvest and after storage of fruit for six months in SafePods and CA storage. In addition, we have added summary quality data for five consecutive years from the Quincy location for comparison. WA 38 was at commercial maturity at harvest, as indicated by starch degradation values of 2.5-3.8, when considering 2-4 an optimum range for WA 38 storage of up to 12 months (using a 1-6 scale). As indicated in the five-year average, the Quincy location typically produces fruit with less sugar but in 2017, apples from Quincy were similar in sweetness than fruit grown at Sunrise. Overall, fruit from all locations stayed firm in storage, and fruit acidity levels remained at a level considered higher than average for fruit out of 6-month CA storage.
In addition, we tasted fruit (data not shown, five fruit/replication, four categories: unripe, ripe, bland, off-flavor). The flavor for all fruit from both locations was determined to be ripe, which we consider to be the optimum flavor achievable.
| Table 1: Fruit quality at harvest, after six months of storage in controlled atmosphere (1% carbon dioxide, 2% oxygen, CA) or in SafePods within CA storage. | |||||
|---|---|---|---|---|---|
| At harvesta | After 6-month CA storageb | ||||
| Sunrise G41 | Quincy | Sunrise G41 (SafePod) |
Quincy (SafePod) |
Quincy 5-yr Avgc (CA) |
|
| Weight (g) | 305.8 | 274.3 | 274.6 | 241.2 | 254.3 |
| Starch (1-6) | 2.5 | 3.8 | na | na | na |
| Firmness (lbs) | 17.7 | 17.1 | 19.0 | 16.9 | 18.7 |
| SSC (Brix) | 12.4 | 12.9 | 13.7 | 13.3 | 12.9 |
| TA (% malic acid) | 0.67 | 0.66 | 0.7 | 0.49 | 0.45 |
| aValues are averages of 10 fruit each. Fruit was picked from several trees and multiple locations within trees. bValues are averages of 4 replications of 10 fruit. c5-year average values for 2012 to 2016 from Quincy. |
|||||
Respiration Rate
The respiration rate for both batches of fruit followed a similar trend (Figure 2). It started out decreasing from November until January, then remained steady until March, and increased in April to levels below the initial at harvest values. The respiration rate for Pod1 and Pod2 respectively started out at values of 0.5 vs. 0.7 ml CO2/kg/hr, plateaued at 0.35/0.42 in February and March, and reached final maximum values of 0.42 /0.58 at the end of the measurements in April. Notably, fruit from location 2 had consistently higher respiration rates compared to fruit stored in Pod1. Compared to Red Delicious respiration rates (comparable CA conditions, internal data SCS, not shown), WA 38 respired at double the rate in CA storage. When comparing WA 38 respiration rate to Envy™ (SCS internal data, not shown), respiration rates are comparable. However, none of the other varieties showed an increase in respiration after five months of CA storage. Based on our fruit quality analysis, we had 1/2 (Sunrise/Quincy respectively, data not shown) decayed apples present in the SafePods, which could have contributed to the elevated rates of respiration.

LOL
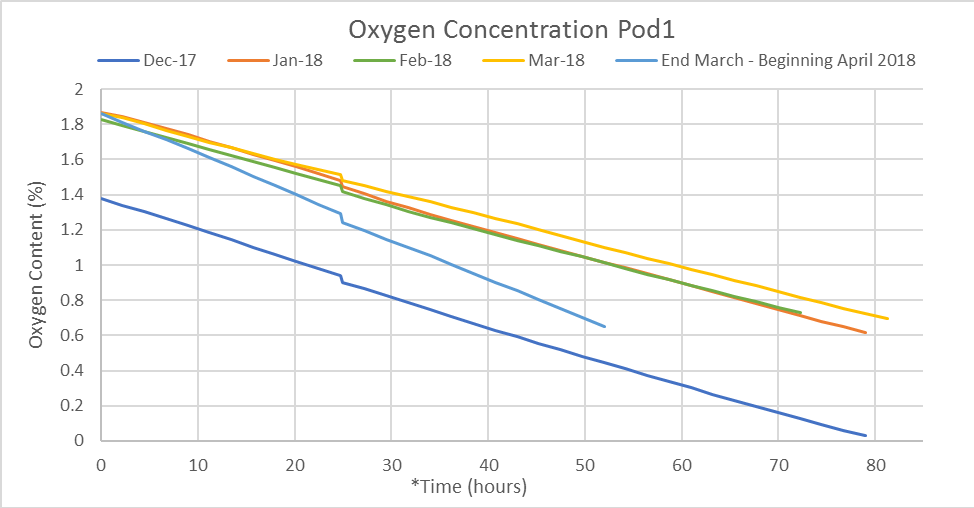
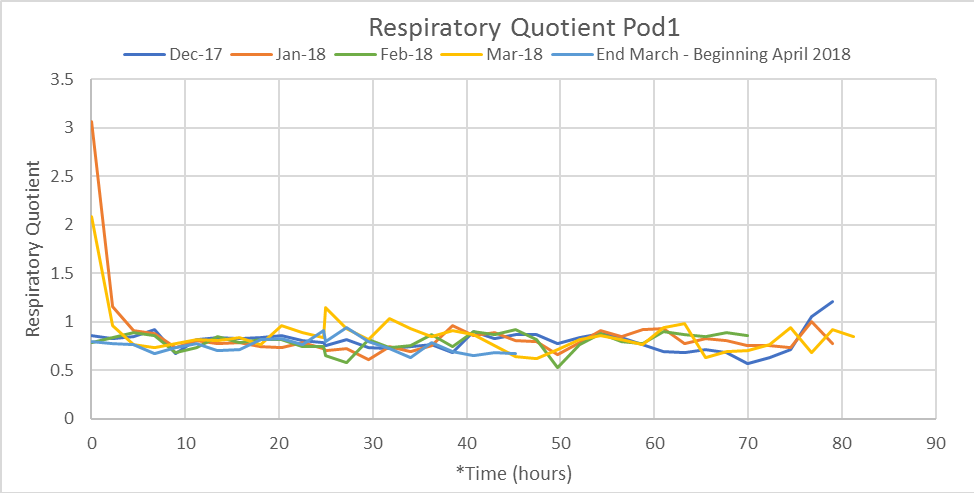
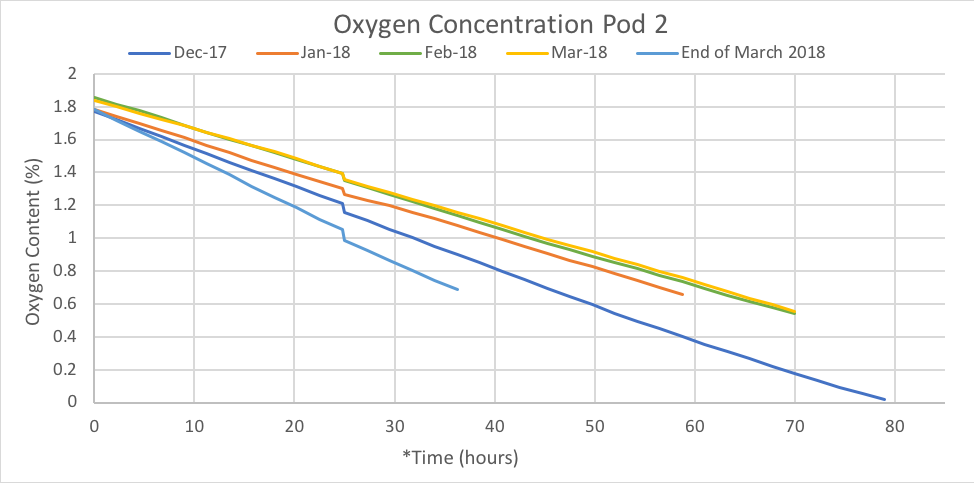
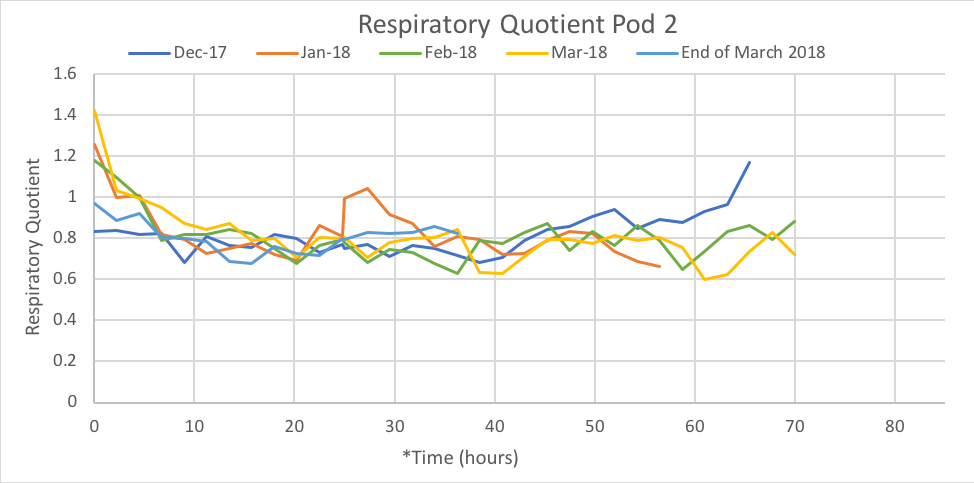
A complete record of data generated during the 11 times both SafePods combined were challenged to lower oxygen concentrations (as % oxygen) is provided in Figures 3 and 4. In general, oxygen concentrations at the beginning of the challenge ranged from 1.54-1.86% (Table 2, Figures 3 and 4). The tests were concluded at oxygen concentrations of 0.53-0.73%, except in two cases, when the oxygen concentration was lowered further to 0.03/0.02% (Pod 1/Pod2, respectively). Only at those two lowest oxygen levels did the RQ spike to levels considered indicative of stress. RQ values were 1.22/1.18 for Pod1/Pod2, respectively at this time. RQ values were highest at the lowest oxygen concentrations, except for the January challenge of Pod1, when the maximum RQ was calculated for 0.65% oxygen at about 2.5 hours prior to exposure to the lowest oxygen level (0.62%).
In addition, the RQ value at the very beginning of the multistep process has been high several times (example Figure 3, Pod1, March 2018). Based on conversations with Ms. Schaefer from SCS, this is considered an aberration. The company has since adjusted their equipment (software update) and added a delay to the system (about 300 minutes). In this new process, the slide valve of the Pod closes, and before recording any values, the Pod sits for 300 minutes to let the fruit acclimate while removing any “noise” (scrubbing, venting, flushing) that might have caused the initial readings to read higher than 1.2.
Based on these results we conclude that WA 38 fruit utilized in this experiment could have been stored at lower oxygen concentrations than 2%, potentially as low as 0.6%. However, this is a very limited data set and more growing seasons, locations, and maturity levels of fruit at harvest should be considered before releasing general storage recommendations on preferred oxygen concentrations for WA 38 in CA. Further, we do not know if prolonged CA storage at oxygen concentrations other than what was used in our experimental CA units (~2%) would lead to undesired effects such as internal browning or the development of off-flavors.
| Table 2: Oxygen concentration (in %) at the beginning and the end of the low oxygen limit (LOL) challenges, and maximum respiratory quotients (RQ). | ||||||
|---|---|---|---|---|---|---|
| Month | Beginning O2 | Ending O2 | RQ maximum | |||
| Pod 1 | Pod 2 | Pod 1 | Pod 2 | Pod 1 | Pod 2 | |
| November | – | 1.81 | – | 0.62 | – | 0.75 |
| December | 1.54 | 1.77 | 0.03 | 0.02 | 1.22 | 1.18 |
| January | 1.56 | 1.74 | 0.62 | 0.66 | 1.00 | 1.04 |
| February | 1.83 | 1.78 | 0.73 | 0.54 | 0.85 | 0.88 |
| March #1 | 1.63 | 1.80 | 0.53 | 0.56 | 0.85 | 0.83 |
| March #2* | – | 1.78 | 0.65 | 0.69 | 0.68 | 0.86 |
| April | 1.86 | – | – | 0.68 | – | – |
| *refers to a second challenge | ||||||
Conclusion & Future Plans
We conclude that WA 38 appears to have the potential ability to be stored at lower than 2% oxygen in CA. In general, WA 38 respiration rates in storage were determined to be medium, when compared to other commercially grown cultivars.
In 2018, we would like to explore:
- Determine respiration rates of fruit in storage from four locations and up to three maturity levels in CA storage (nine months, oxygen 2%, carbon dioxide 1%). Perform LOL challenge studies monthly (from 2% to 0.02% or until RQ ≥ 1.2)
- Store fruit from up to three locations and harvested at optimum maturity in CA at 0.6% oxygen (carbon dioxide 1%) and record respiration rate, storage performance, and final taste profile of the fruit.
Acknowledgments
We would like to acknowledge the assistance of Enrique Garcia (Stemilt R&D), and members of the WTFRC team: Mackenzie Perrault, Blanca Ruiz, Monique Borba, and Sandy Stone. We are thankful to SCS for donating two SafePods to be used in this experiment.
