![]() Prepared as a research report for the Washington Tree Fruit Research Commission by Ines Hanrahan, Executive Director; Manoella Mendoza, Research Technician; and Monique Borba, Intern. Mar 24, 2020.
Prepared as a research report for the Washington Tree Fruit Research Commission by Ines Hanrahan, Executive Director; Manoella Mendoza, Research Technician; and Monique Borba, Intern. Mar 24, 2020.
Collaborators: Tom Auvil, formerly Washington Tree Fruit Research Commission; Kate Evans, Washington State University, Tree Fruit Research and Extention Center.
Project Goal: Describe the size distribution of WA 38 apples for WSU Apple Breeding Program Phase 3 plantings.
Introduction
WA 38, a novel apple variety resulting from a cross between Enterprise and Honeycrisp at Washington State University in 1997, is a firm and juicy, bicolored apple that will develop an attractive dark red tone, if fully exposed to sunlight. This apple presents desirable characteristics such as excellent long-term storage potential and minimal postharvest disorder incidence. During the pre-commercial phase of its development (referred to as WSU apple breeding program Phase 3), the Washington Tree Fruit Research Commission (WTFRC) determined a wide range of horticultural performance parameters, including the fruit size profile of this apple variety.
The purpose of this report is to show the fruit size distribution of two maturing orchards between the years 2010 to 2016 (years 2-8 of production) and to show the variation of sizing profiles in top-worked orchards during two years of production for the Quincy (2013/2014) and Prosser (2014/2016) locations. Knowledge of fruit size distribution is important to predict productivity of trees and to verify if fruit will produce a size profile suitable for market demands.
Methods
Size distribution profiles were created based on the yearly total fruit available to the WTFRC internal program from both Quincy and Prosser locations. Fruit was harvested in crates (volume ca. 30 lbs.) and stored at the Stemilt Research CA (RCA) facility. Each year, as fruit was sampled from storage, apples were individually weighed (in grams) and assigned a box size (48 to 113). Box size was determined by dividing the box weight of 40lb. (18,160 g) by the actual fruit weight:
| Approximate box size (grams) = 18,160/apple |
The formula generated an approximated box size that was adjusted to fit actual box size categories. Apples classified to a box size smaller than 48 were included within the 48-box size count. Likewise, the category 113 encompasses box sizes of 113 and higher (up to 150).
Trees were in their second year of production in 2010 in both locations. From 2010 to 2013, limited amounts of fruit were included into the sizing profile, because weights were recorded only from fruit utilized for quality analyses. In 2014, all apples harvested by WTFRC were weighed, including fruit used for meetings and events. In 2015, WA 38 was commercialized, and fruit quality analyses and research trials were scaled back from these plantings.
Results & Discussion
1. Yield Calculation
The yield data was calculated in bins per acre for Quincy from 2010 (2-year-old trees) to 2016 (8-year-old trees). The first year of production (2010) from 2-year-old trees resulted in 14 bins per acre (Figure 1). From 2011 to 2013 total yield was between 45 to 50 bins per acre, peaking in 2014 (93 bins/acre) and decreasing in 2015 (61 bins/acre) and 2016 (75 bins/acre).

For the WA 38 grafted trees in Quincy the 1st year of production (2013) had the lowest yield, 37 bins per acre. In 2014 the total yield increased 27% to 74 bins per acre.
2. Quincy WA 38 Fruit Size Distribution
The results of the fruit size distribution by classes for the Quincy location are shown in Figure 2. Each size class category is displayed as percentage of total fruit from which weight was recorded. Box size categories were combined into 4 classes. Class 1 corresponds to bigger fruit, sizes 46-56. Class 2 includes fruit of box size 64 and 72, class 3 includes box sizes 80 and 88, and class 4 corresponds to the smaller fruit sizes, box size 100 and higher.

In 2010, most apples were concentrated in class 1 (60%). From 2011 to 2016, the largest volume of apples was concentrated in class 2. Overall, the box size distribution for WA 38 in Quincy was concentrated in class 2 (sizes 64 and 72).
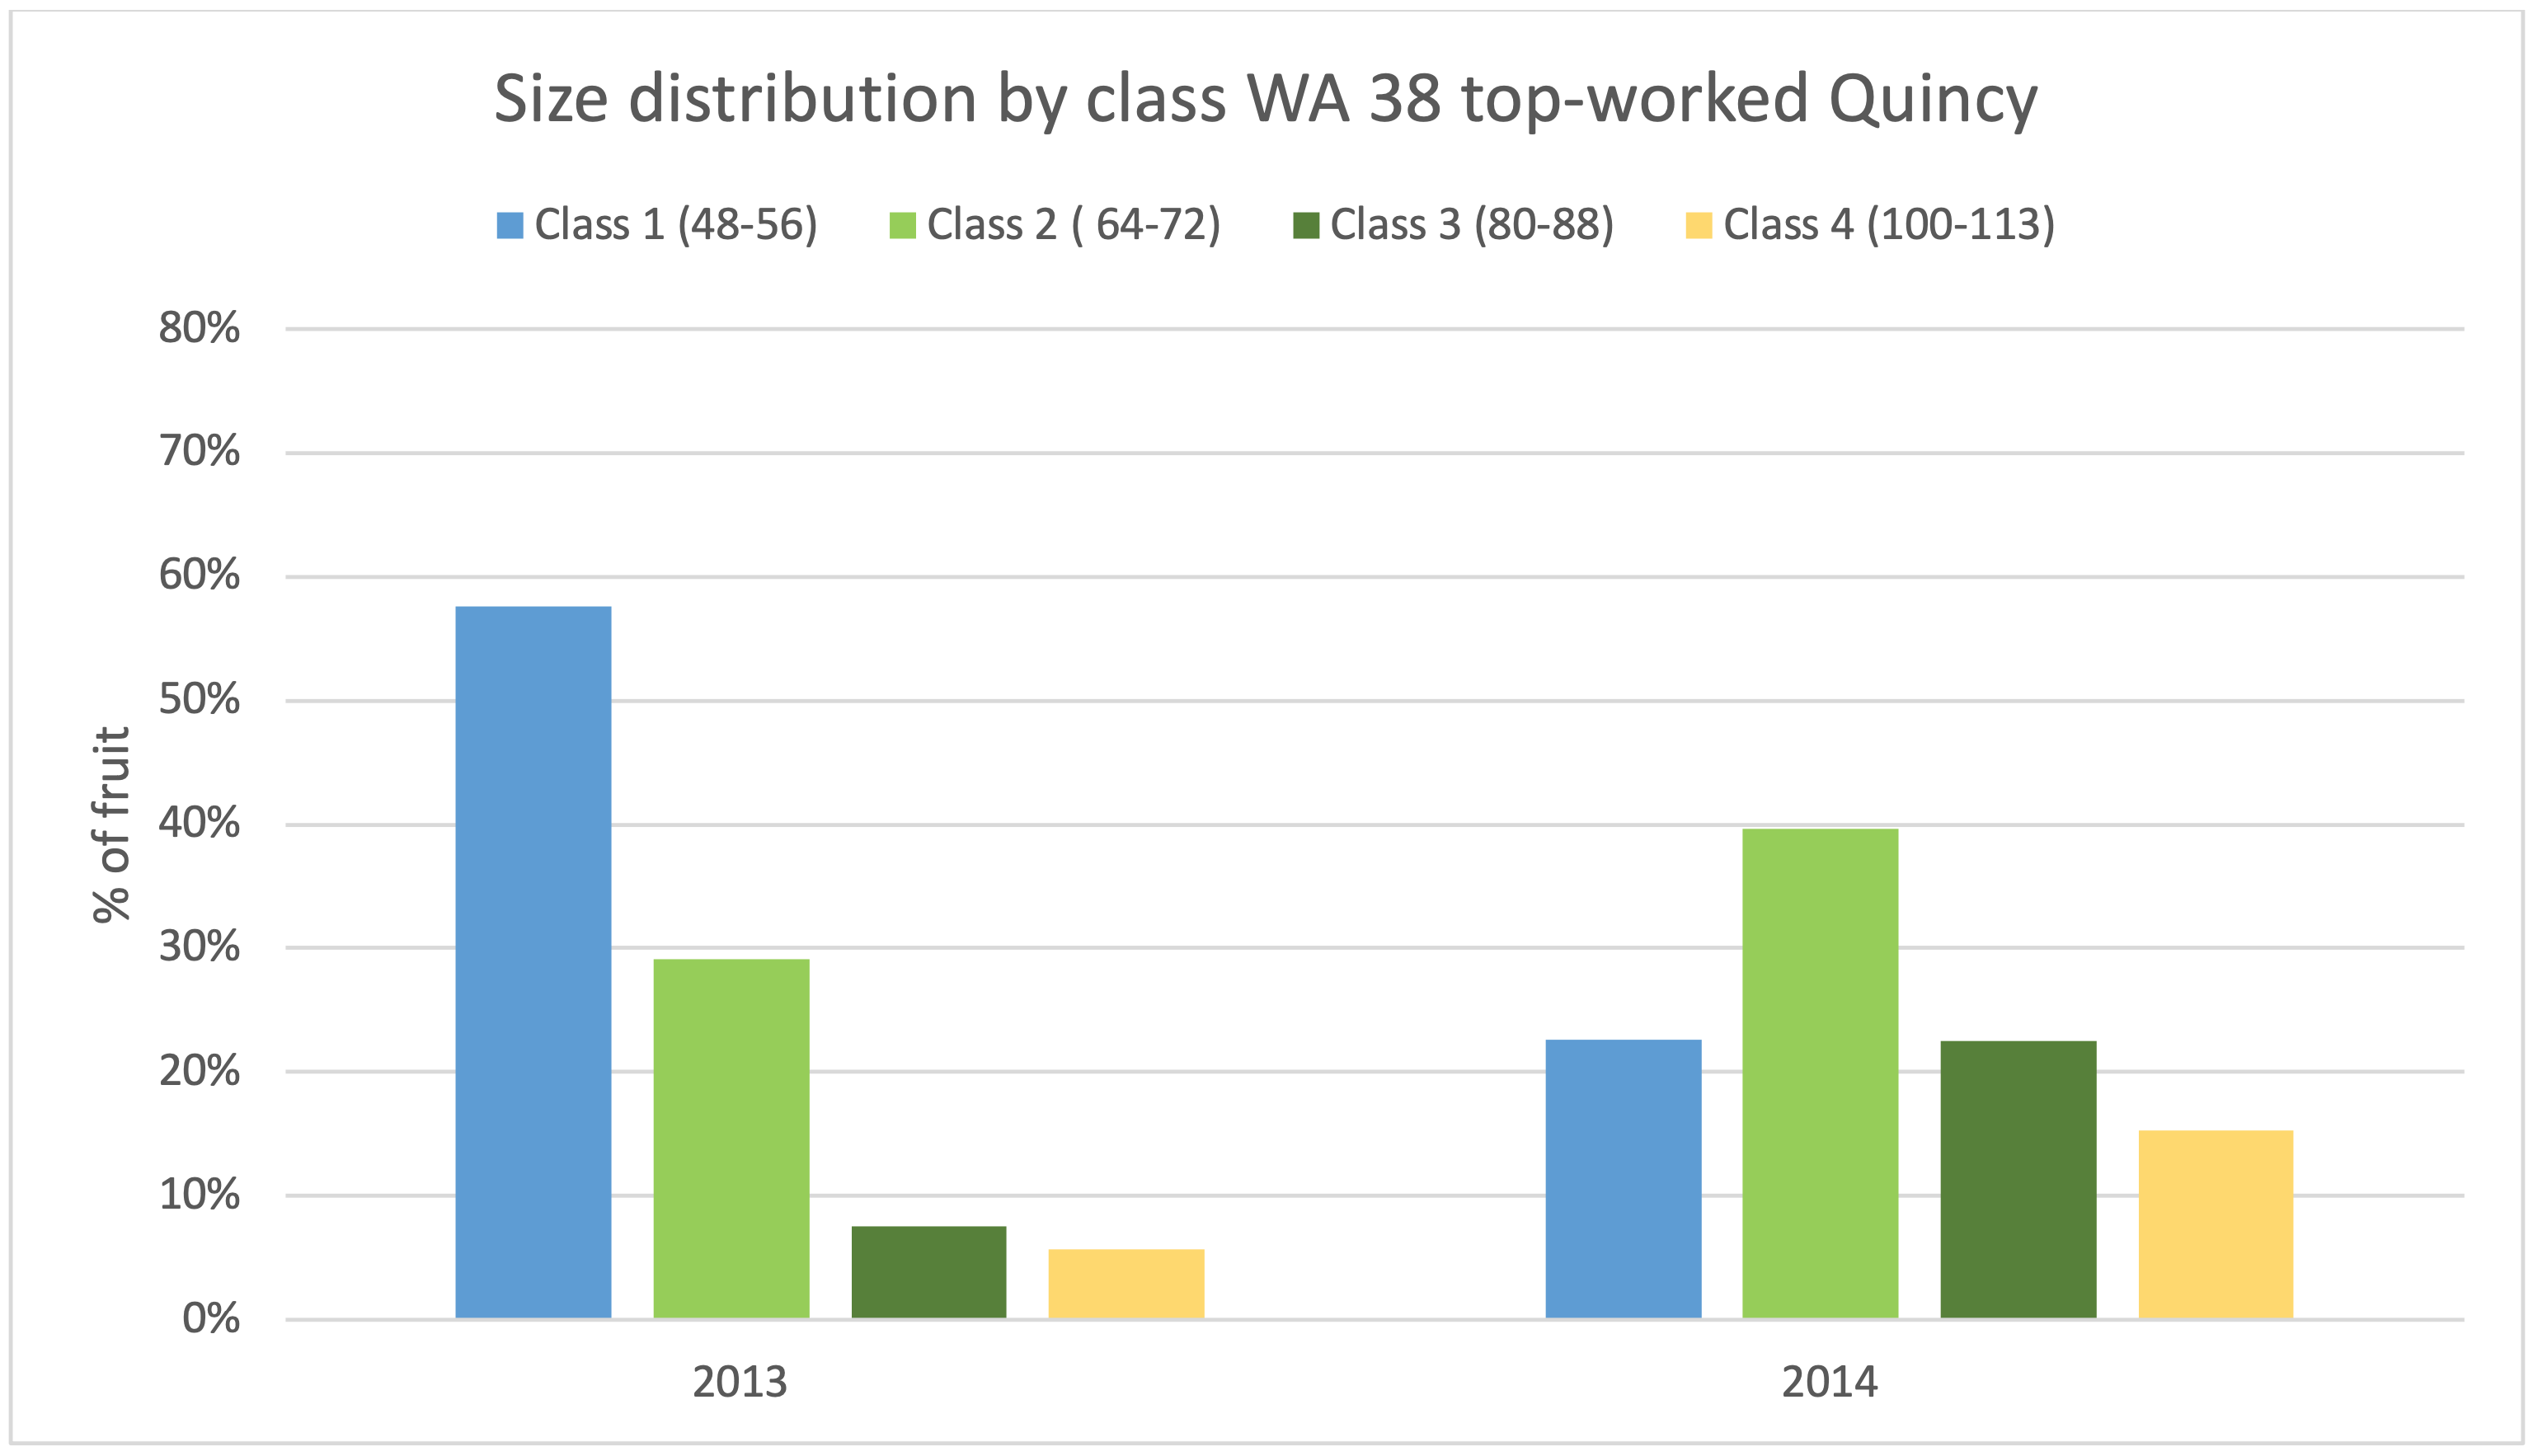
3. Quincy Top-worked WA 38 Box Size Distribution
The results of the box size distribution by classes for the top-worked trees from Quincy location are shown in Figure 3. In 2013, most apples (58%) were concentrated in class 1 (corresponds to the class of bigger fruit). In 2014, Class 2 showed a greater volume of fruit.
4. Prosser WA 38 Fruit Size Distribution
Figure 4 shows the box size distribution of WA 38 in Prosser distributed by classes. In 2010 most apples were classified as class 1 (67%), prevailing bigger fruit. From 2011 to 2013, the largest volume of fruit was concentrated in class 2 (52%, 33% and 50%). In 2014 the number of apples in classes 1 and 2 were very similar (44% and 41%, respectively). Class 3 was the box size range category with the greatest amount of fruit in 2015 (38%). In the last year of evaluation (2016), most apples were classified as class 1 (62%). Considering all years of evaluation, larger apples were more prevalent in Prosser with box sizes ranging mostly from 48 to 72.

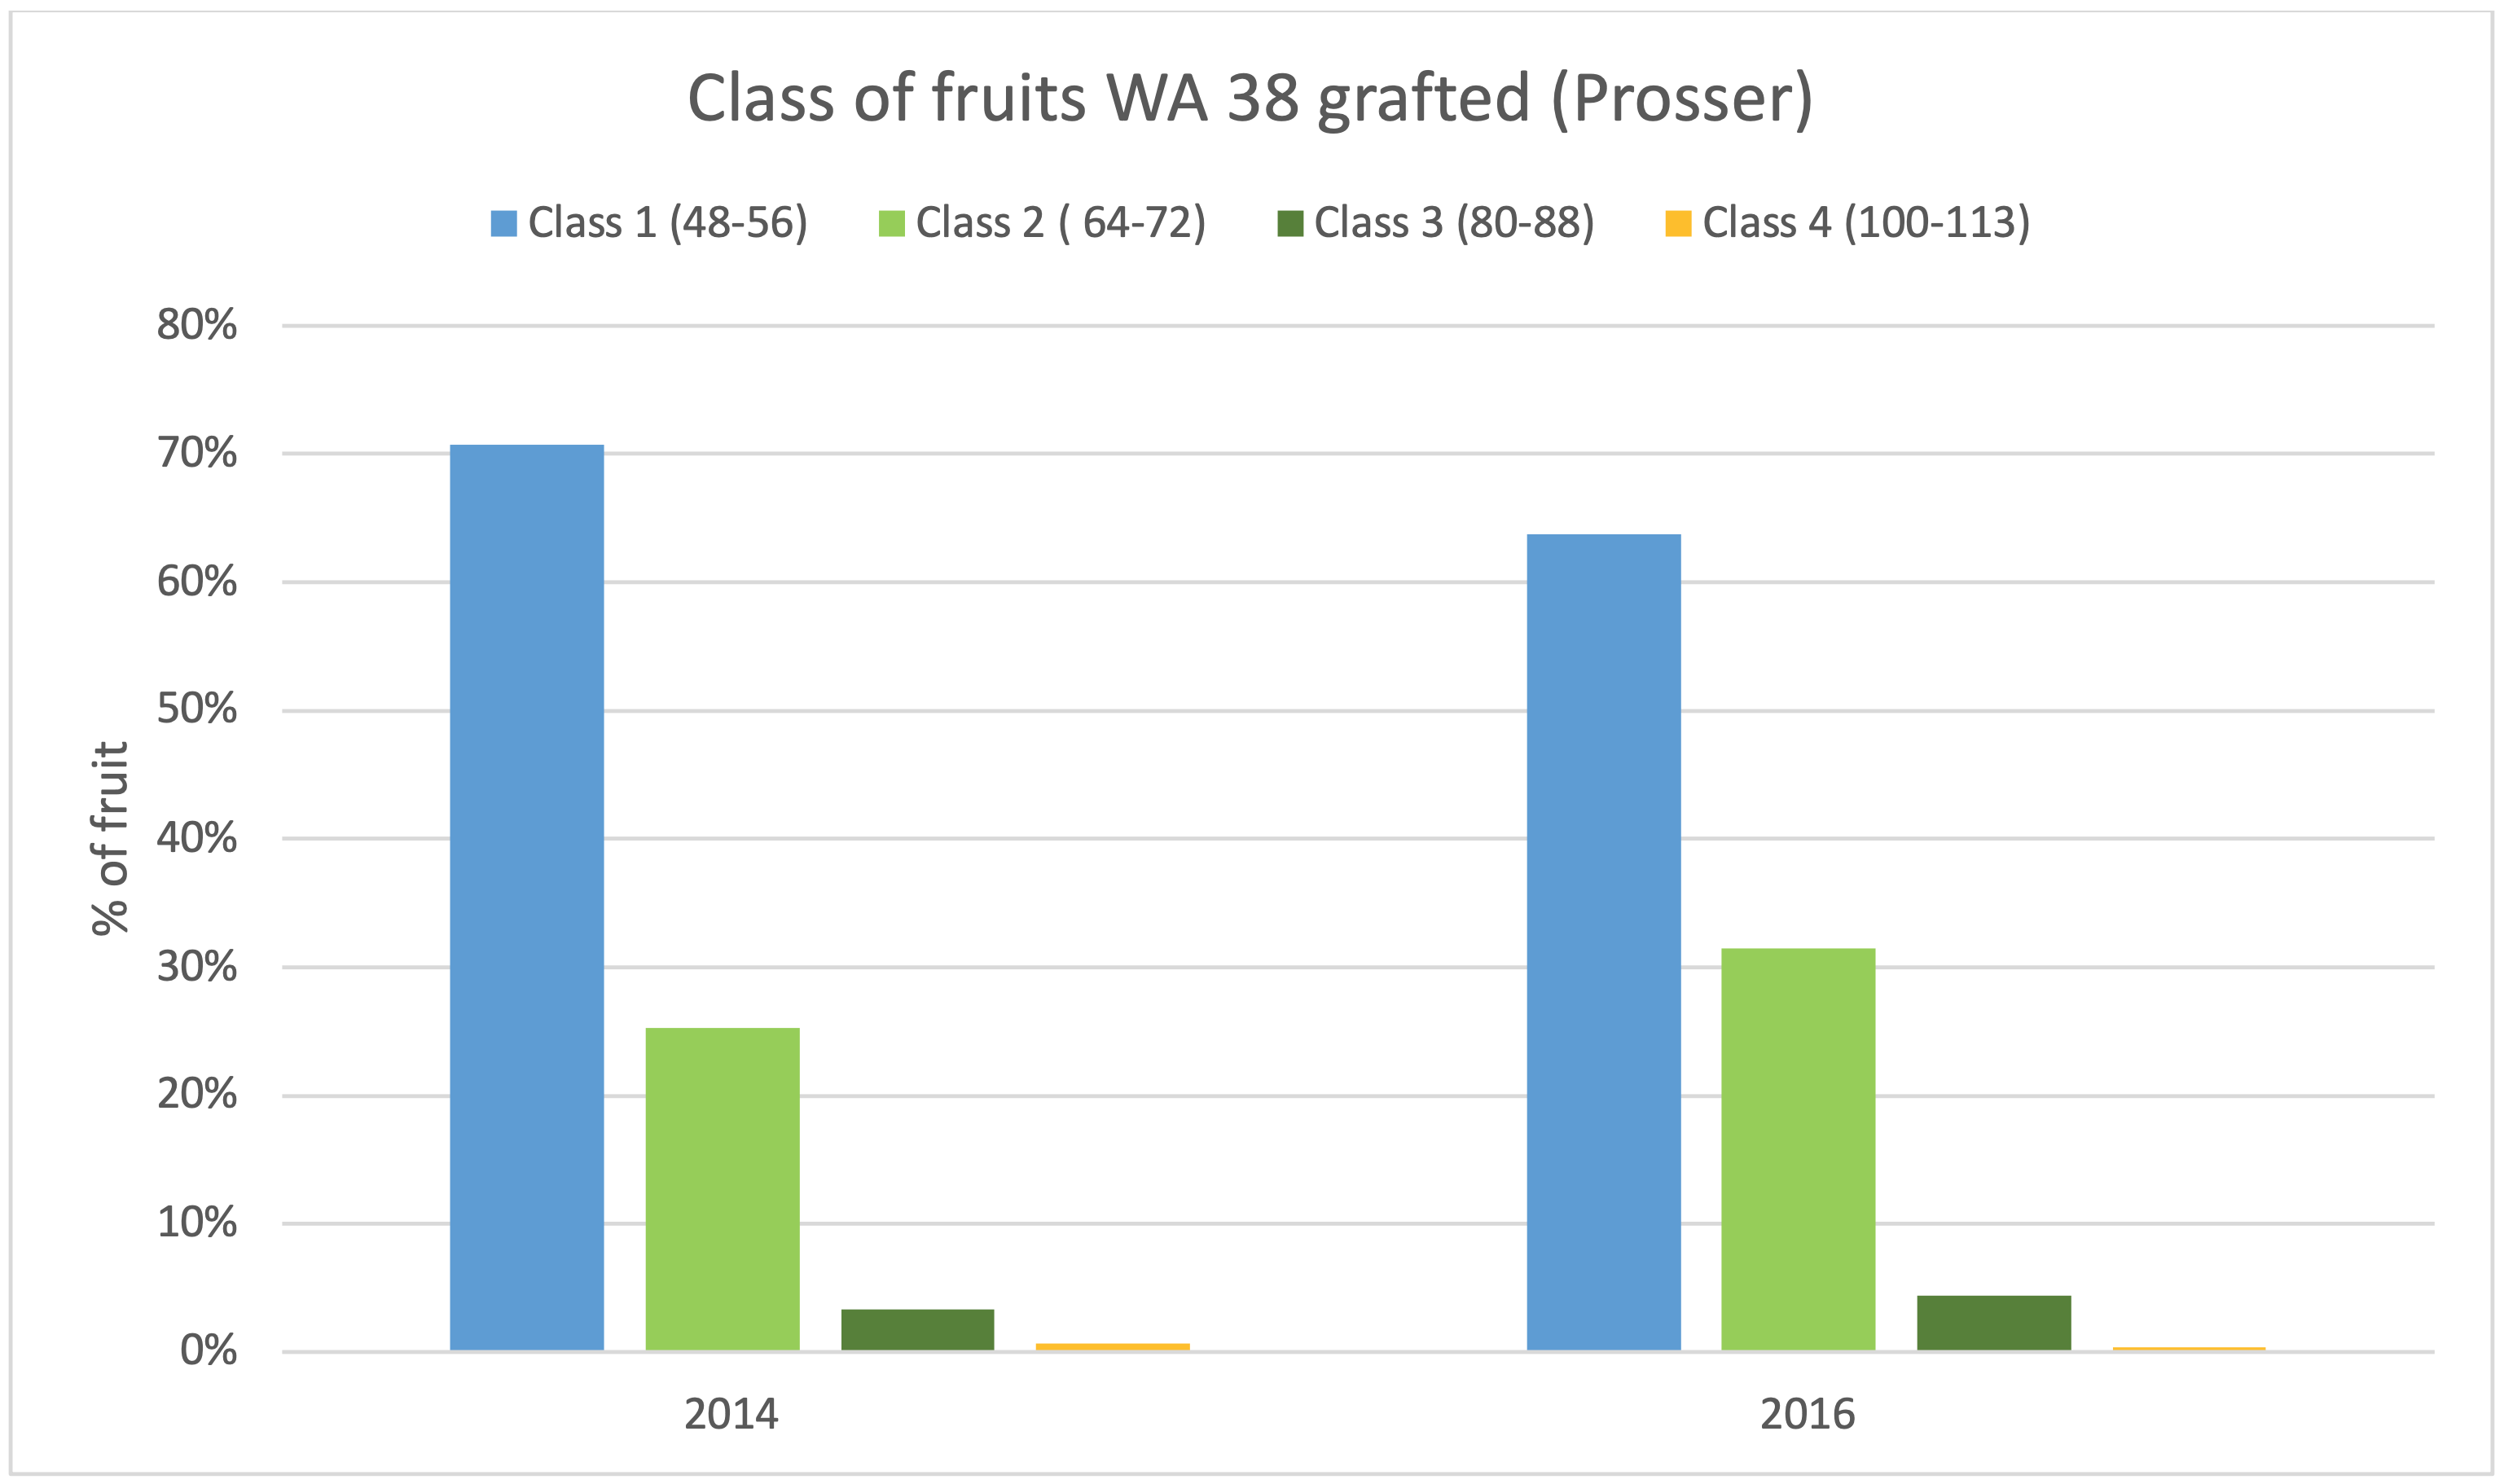
5. Prosser Top-worked WA 38 Size Distribution
Results of the fruit size distribution for the top-worked trees at Prosser location are shown in Figure 5. The graph divided by classes shows that independent of the year, most apples were concentrated in class 1 (sizes 48 and 56), 71% in 2014 and 64% in 2016.
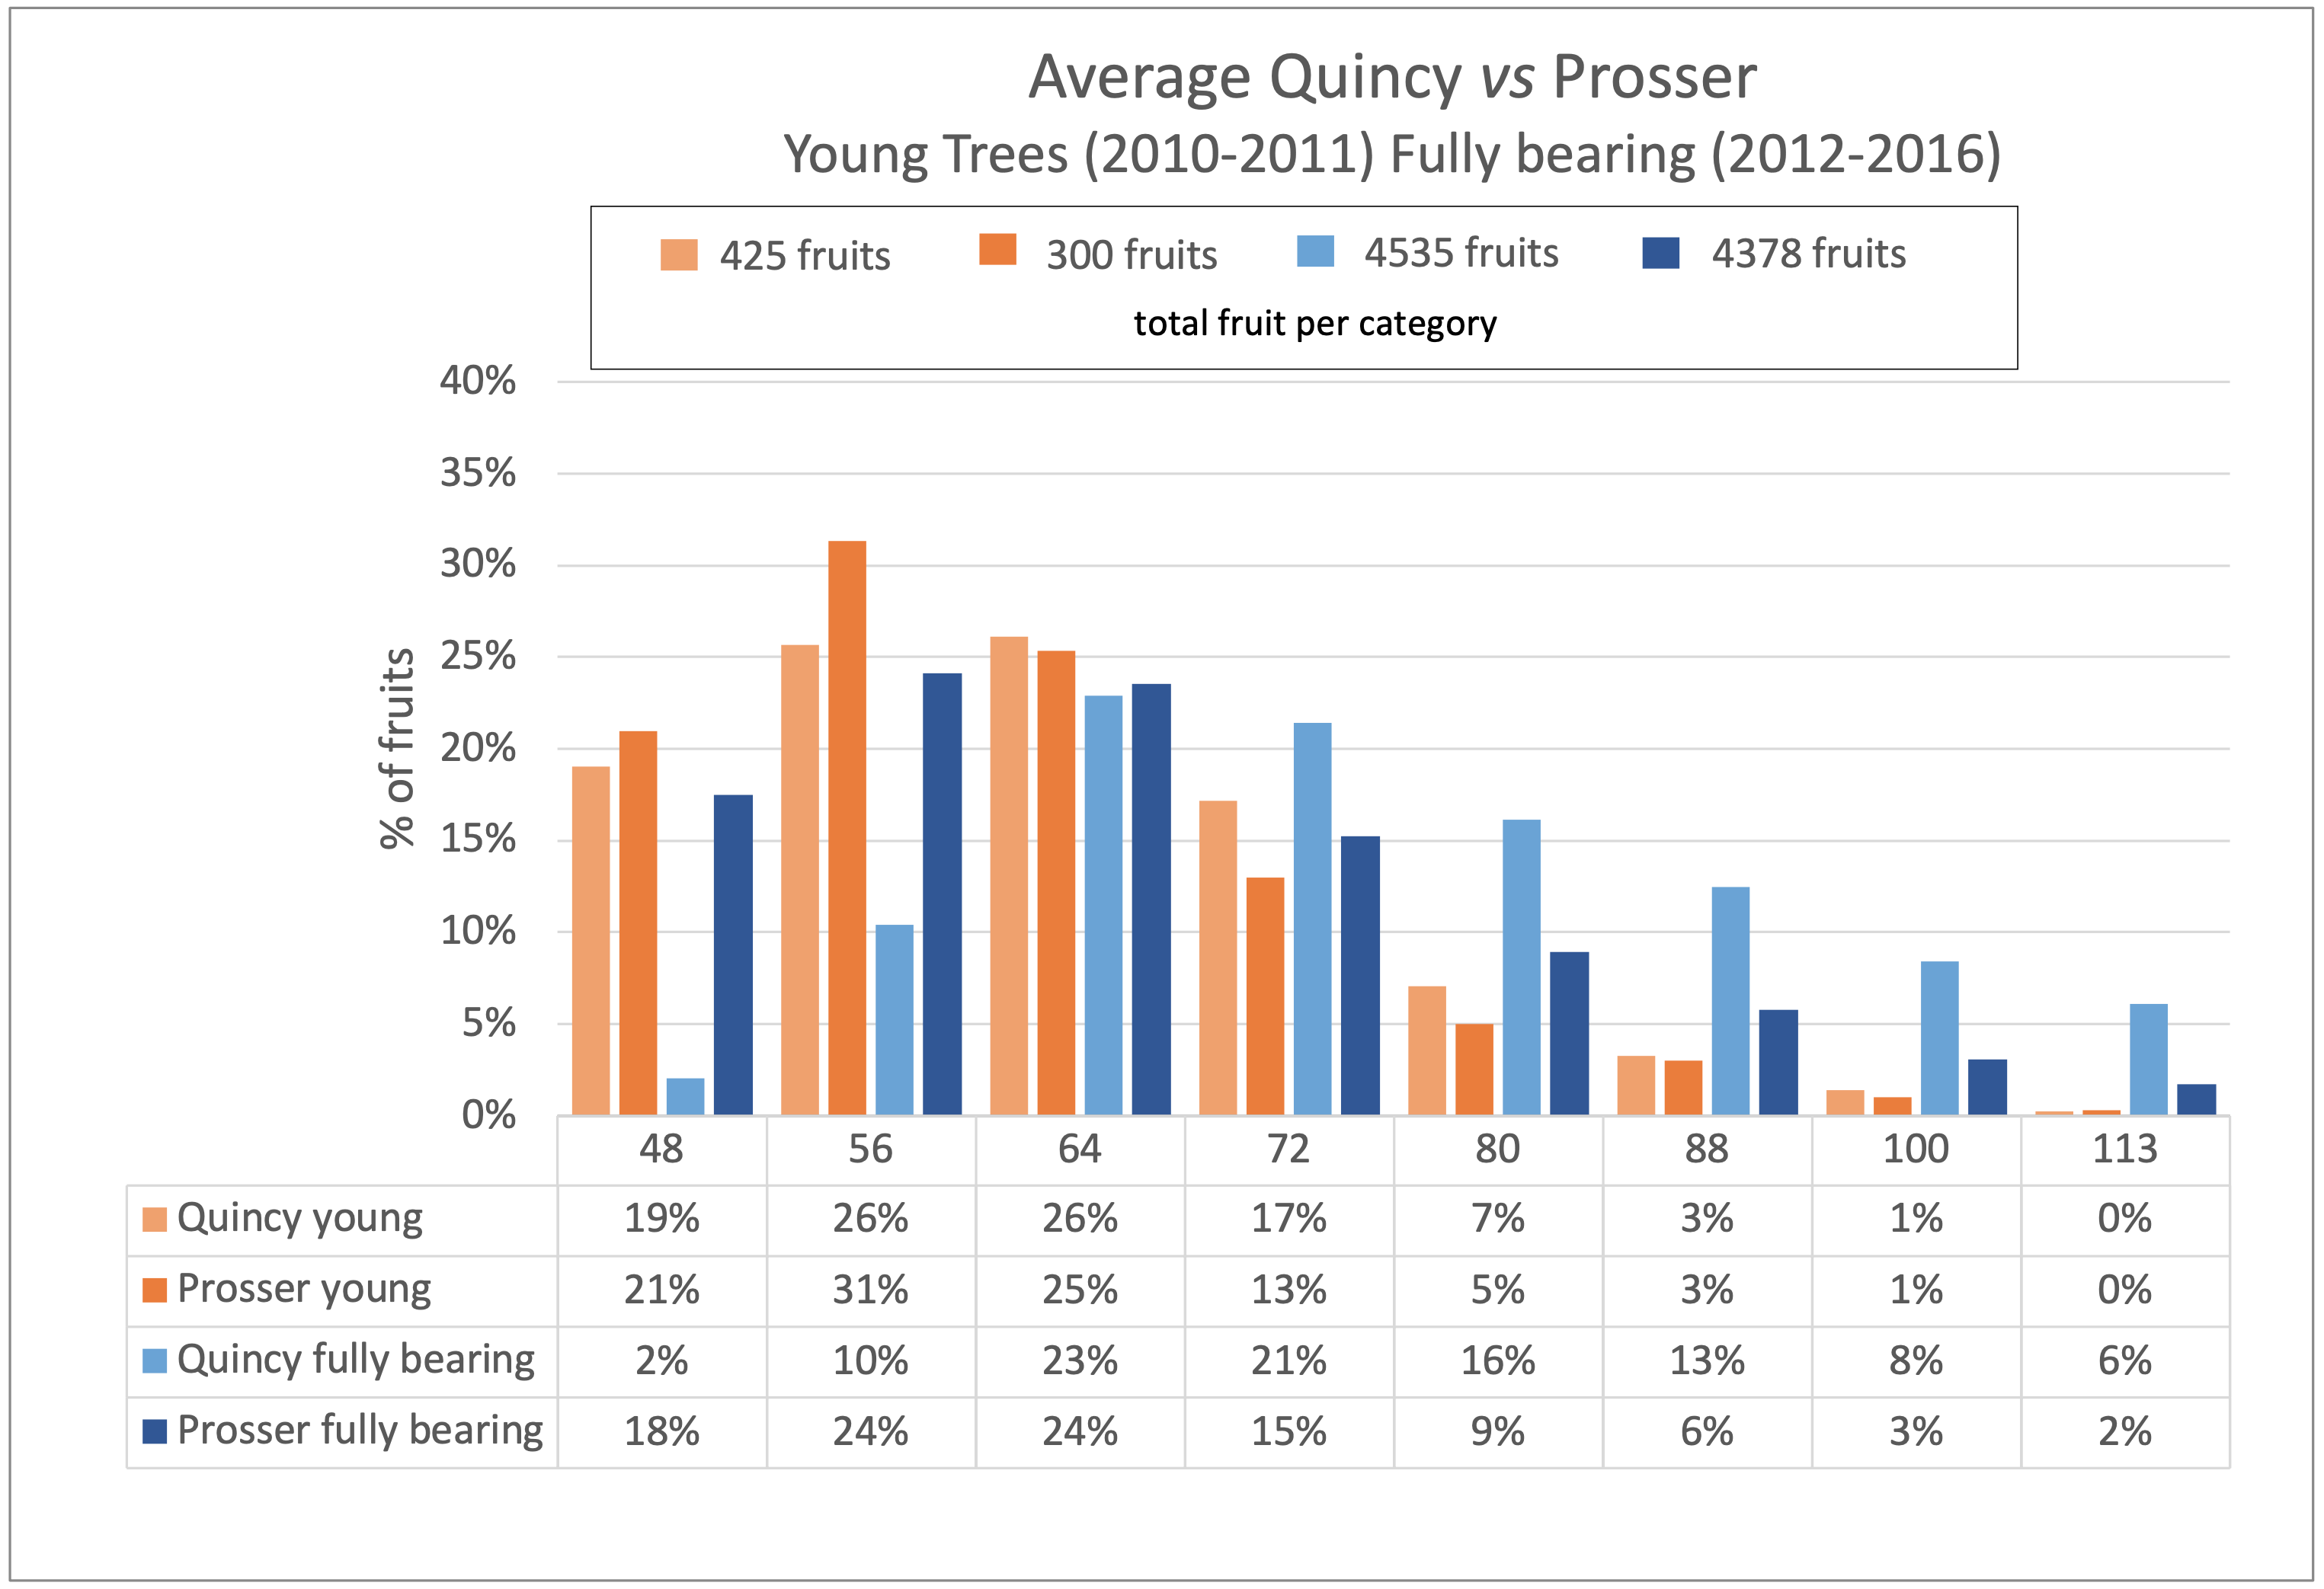
6. Box Size Distribution Comparison for Orchard Location: Quincy vs Prosser
Young trees (2010-2011) in both locations (Prosser and Quincy) had a similar fruit size distribution (Figure 6). For both locations, the largest amount of fruit is assigned to box size categories 56 and 64. There were 26% and 31% of apples classified as box size 56, and 26% and 25% as box size 64, for Quincy and Prosser, respectively.
Fully bearing trees (2012-2016), as shown in Figure 6, demonstrated that in Quincy, the largest volume of apples was concentrated in box sizes 64 and 72 (23% and 21%, respectively). In Prosser, box sizes 56 and 64 prevailed, both with 24% of the total apples evaluated. The percentage of fruit from fully bearing trees classified as box size 64 was similar between Prosser and Quincy. Overall, fruit grown in Quincy was smaller on average, having more fruit classified as box sizes 80 and 88 (16% and 13%, respectively) compared to Prosser (9% and 6%, respectively).
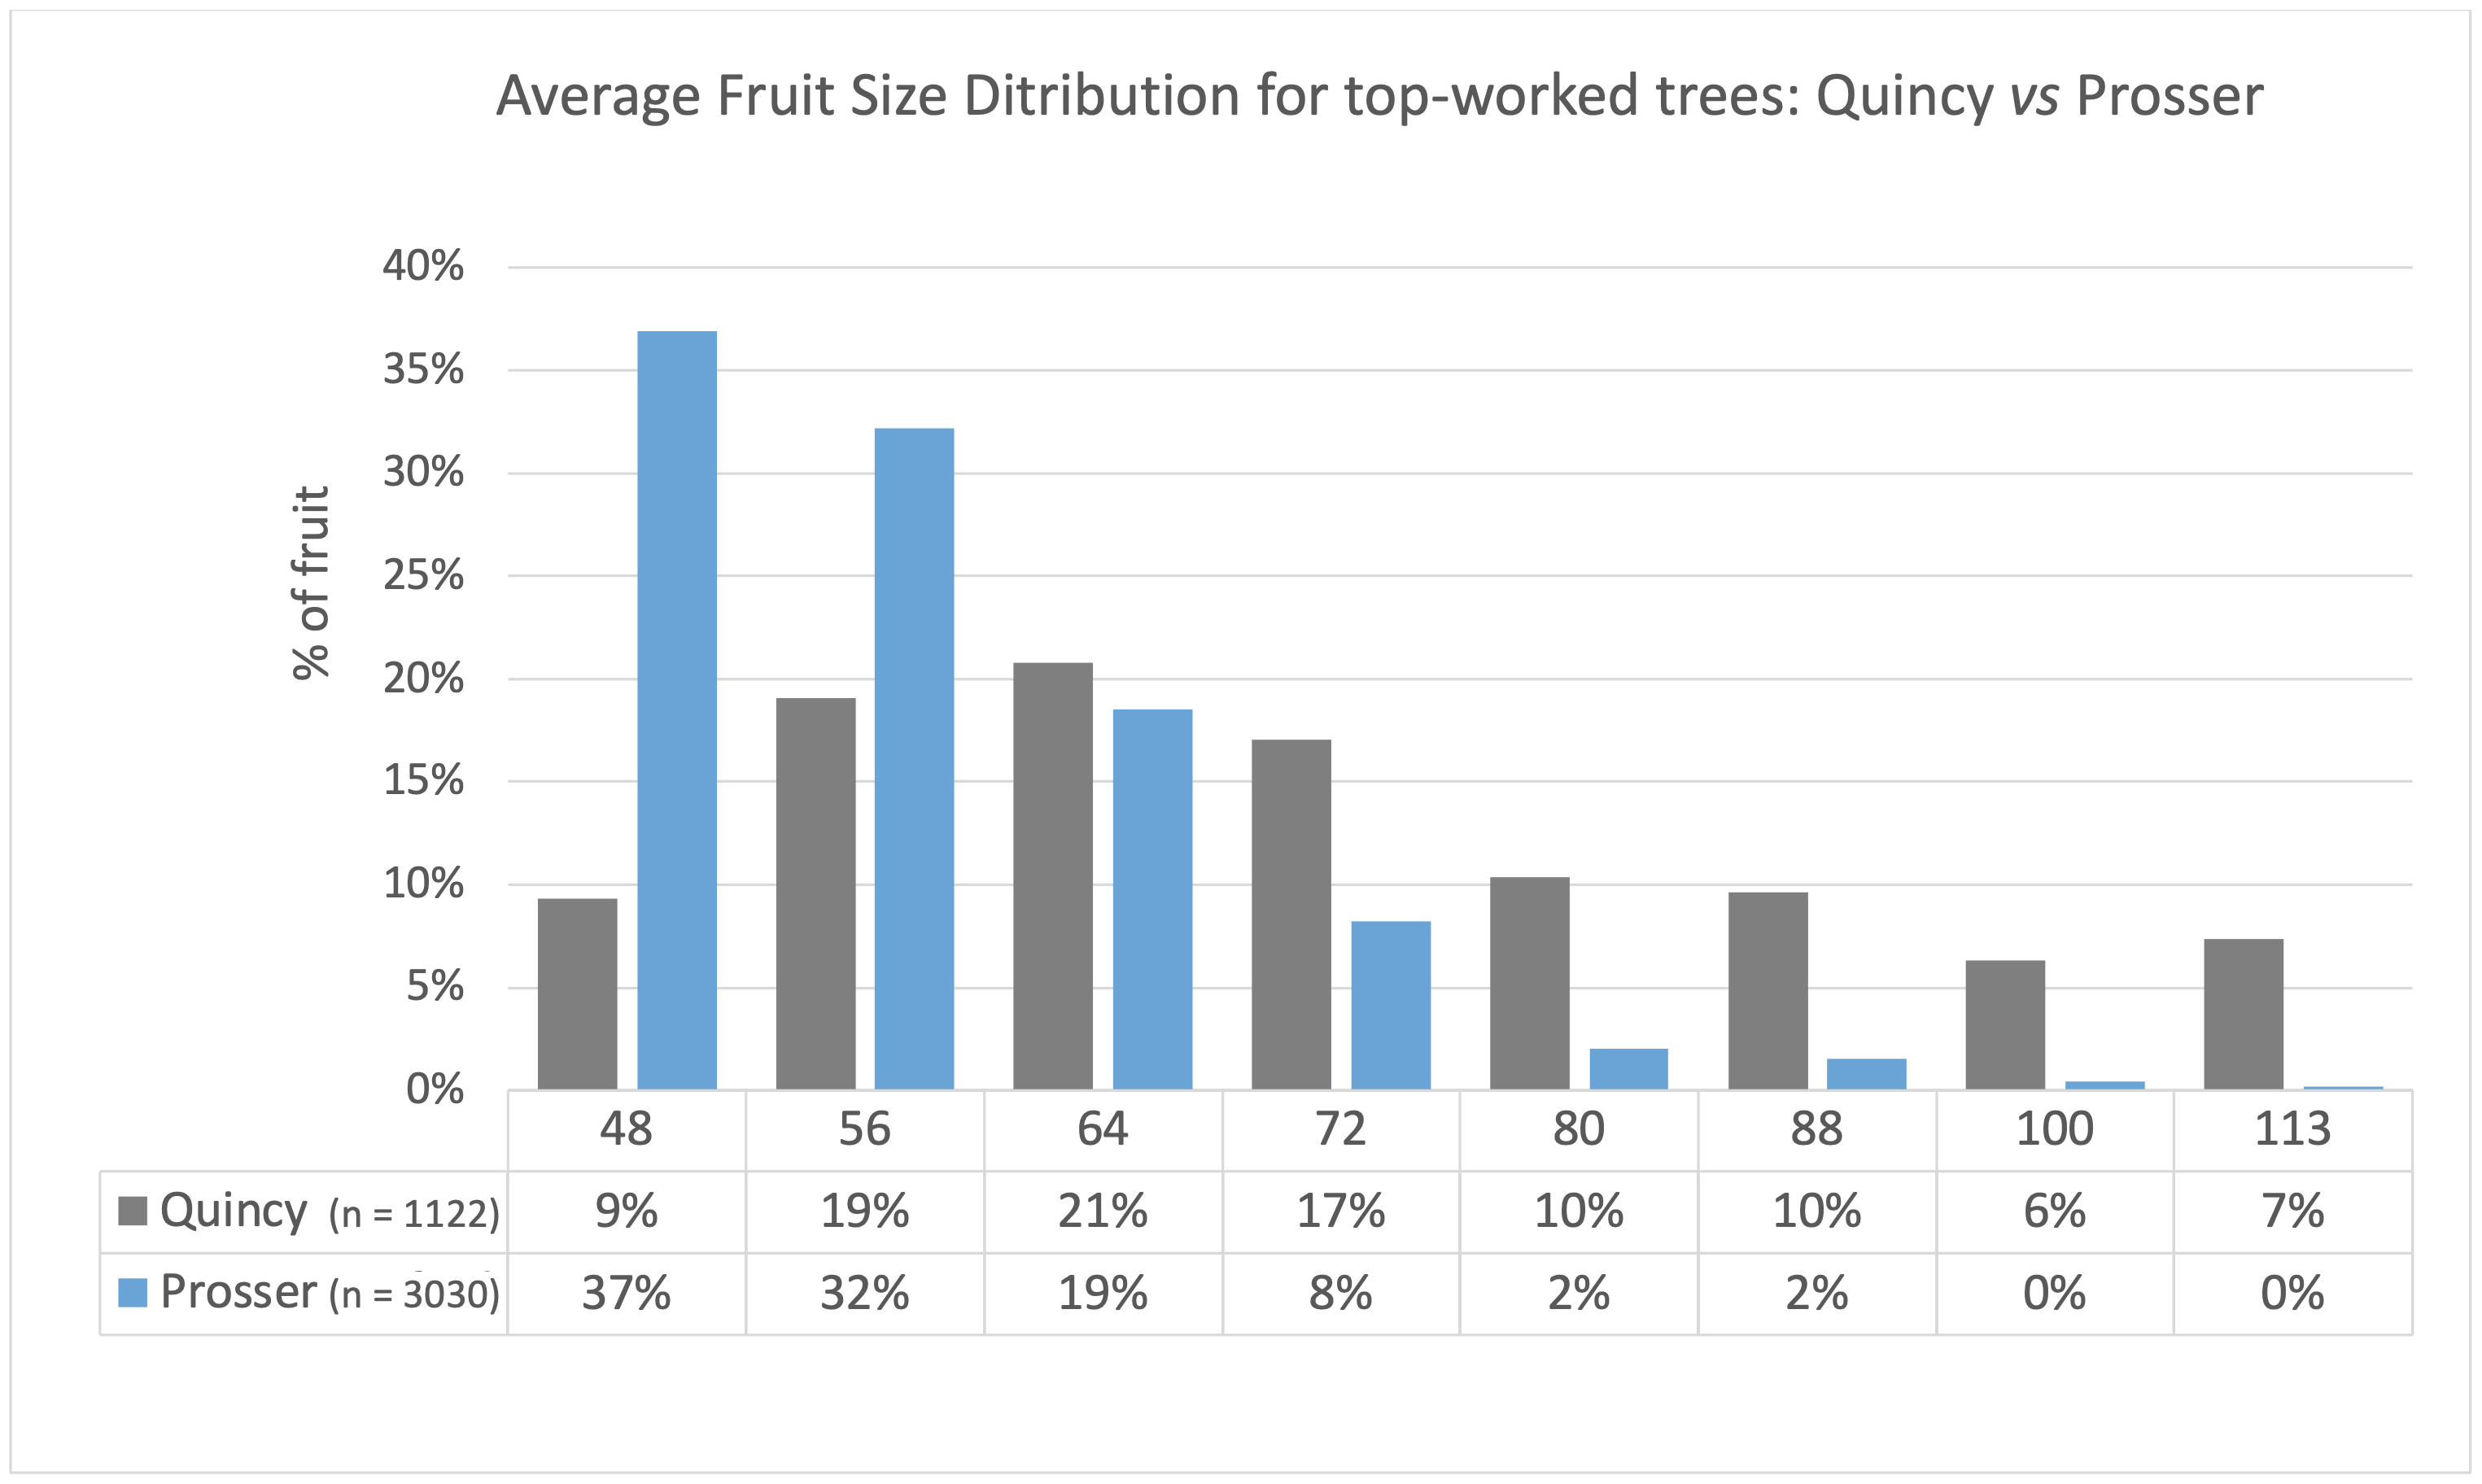
7. Box Size Distribution Comparison: Top-worked Orchards in Quincy vs Prosser
The size distribution from top-worked trees showed that Prosser grew bigger fruit in a smaller size window (Figure 7), the majority between box sizes 48 and 72. Quincy had a wider size distribution ranging from box size 48 to 113, the majority of fruits between 56 and 72, and a fair amount of smaller fruit (13%) when compared to Prosser (0%) in box size 100 and bigger.
Conclusion
Based on the WSU apple breeding program Phase 3 samples, box size distribution profile of WA 38 indicates that regardless of orchard location (Quincy or Prosser) fruit sizes are concentrated in class 1 (48-56) and class 2 (64-72), and the prevailing fruit size is large to medium. In both locations, 2010, the second year of production, yielded the biggest fruit size overall. Top-worked trees also produced large size fruit in both locations, with Prosser having larger fruit than Quincy.
This variety tends to produce large fruit, regardless of crop load. Even with high yields, (see Quincy, 2014, 93 bins/acre) fruit size peaked in classes 64-72.
Acknowledgements
Grower collaborators; BPAC members; WTFRC team; WTFRC student interns
Contact
 Ines Hanrahan
Executive Director
Washington Tree Fruit Research Commission
hanarahan@treefruitresearch.com
Treefruit.wsu.edu articles may only be republished with prior author permission © Washington State University. Republished articles with permission must include: “Originally published by Washington State Tree Fruit Extension Fruit Matters at treefruit.wsu.edu” along with author(s) name, and a link to the original article.
