by Tianna DuPont, WSU Extension; Lee Kalcsits, WSU Horticulture; Troy Peters, WSU Biological Systems Engineering November 2021
Hot summers and cork spot in d’Anjou pear can be a significant challenge in Central Washington. Cork spot is responsible for an estimated $7 to $8 million dollars in losses to d’Anjou production every year. For example in 2017, cork spot accounted for approximately 33% of d’Anjou culls at 3 major packing houses. Irrigation frequency and timing, as well as good calcium programs can affect tree growth, productivity and fruit quality in pears. Fruit size is also critical for high returns. The following case studies illustrate common irrigation system challenges in pear orchards and the results of system upgrades designed to address site specific challenges.
Case Study Orchard A
Site Challenges
- Run-off
- Small fruit
- Inability to conduct tractor work when sloping field stays wet
- Lack of uniformity, variable weak trees.

Figure 1 Standard system created run-off in order to maintain sufficient moisture at the top of the slope.
Standard System
Impact sprinklers (Rainbird) on 36 foot by 36 foot spacing. Growers generally run 1 row at a time skipping a row as they go across the field and return, taking 9 days to irrigate the five-acre field.
| Table 1. Orchard A Standard: System Description | ||||
| Sprinklers per acre | GPM* | GPH per acre | Efficiency | Inches per hour |
| 34 | 4.0 | 8067 | 0.5 | 0.15 |
* per sprinkler head.
Upgrade
R10 micro sprinklers were installed every row on a 18 by 18 ft spacing in a five-acre field encompassing one half of the sloped field in spring 2018. The design was chosen in limit run-off and increase
| Table 2. Orchard A Upgrade: System Description | ||||
| Sprinklers per acre | GPM* | GPH per acre | Efficiency | Inches per hour |
| 134 | 0.43 | 3469 | 0.7 | 0.09 |
*per sprinkler head.

Figure 2 R10 micro-sprinkler system upgrade.
application uniformity. With a low application rate and a higher number of sprinklers per acre the soil can absorb the water applied reducing run-off. Reduced application rate allows for a larger number of lines to be run simultaneously such that the field can be watered in a shorter period of time.
Grower Observations
“Zero run off in the new system.”
“Leaf color was more uniform.”
“Before the quickest we could water was 9 days. Now if we want to we can water the whole block in 2 days (20 lines at a time) allowing for more flexibility.” “If we need to push water it is a lot easier.”
“Good to have less water more often.”
Impact on Water Use
| Table 3. Per Acre Water Use | |||||
| Year | Standard | Upgrade | Savings | ||
| hours | gal | hours | gal | gal | |
| 2018 | 144 | 1161600 | 216 | 749232 | 412368 |
| 2019 | 156 | 1258400 | 156 | 541112 | 717288 |
| 2020 | 180 | 1452000 | 252 | 874104 | 577896 |
z18 weeks x15 weeks
y Application timing and set length per grower.
Impact on Soil Moisture
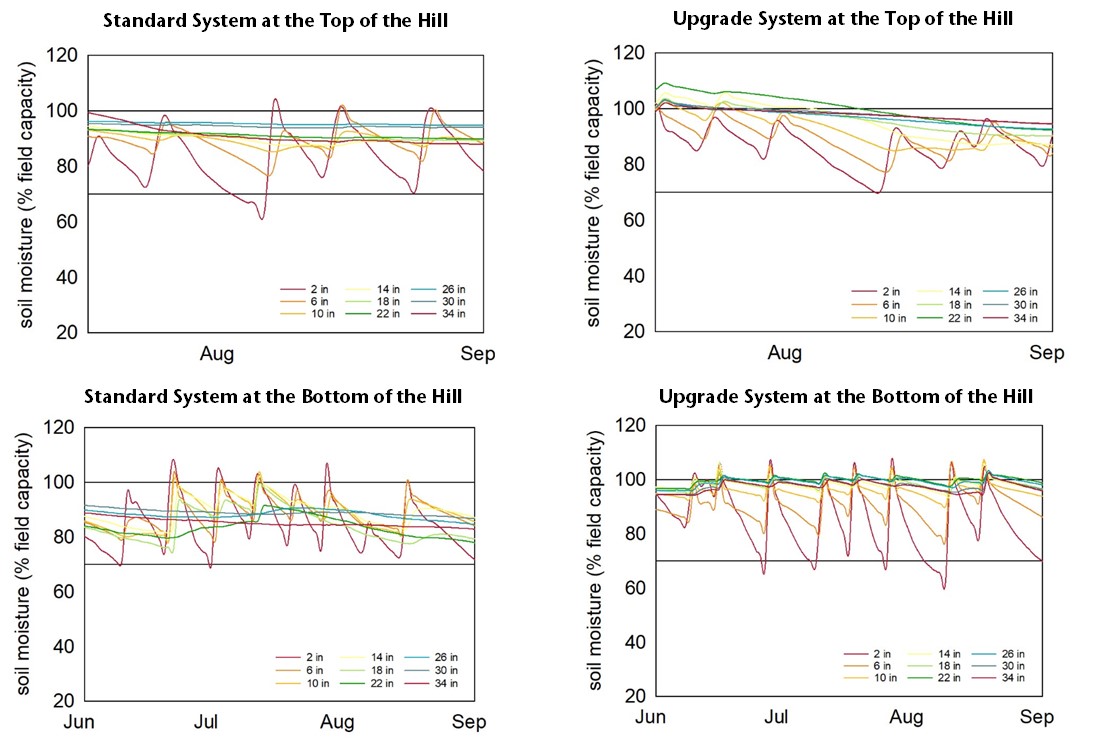
In the standard system it is difficult to maintain adequate soil moisture at the top of the hill and the bottom of the hill tends to have soil moisture that is over-saturated. This is because of run-off, low-pressure draining of water when the system is turned off, and often differences in the water tables from the top to the bottom of the orchard. The system upgrade allowed the managers to maintain soil moisture in the optimum zone, between 70% and 100% of field capacity (Figure 3, 4).

Impact on Tree Stress
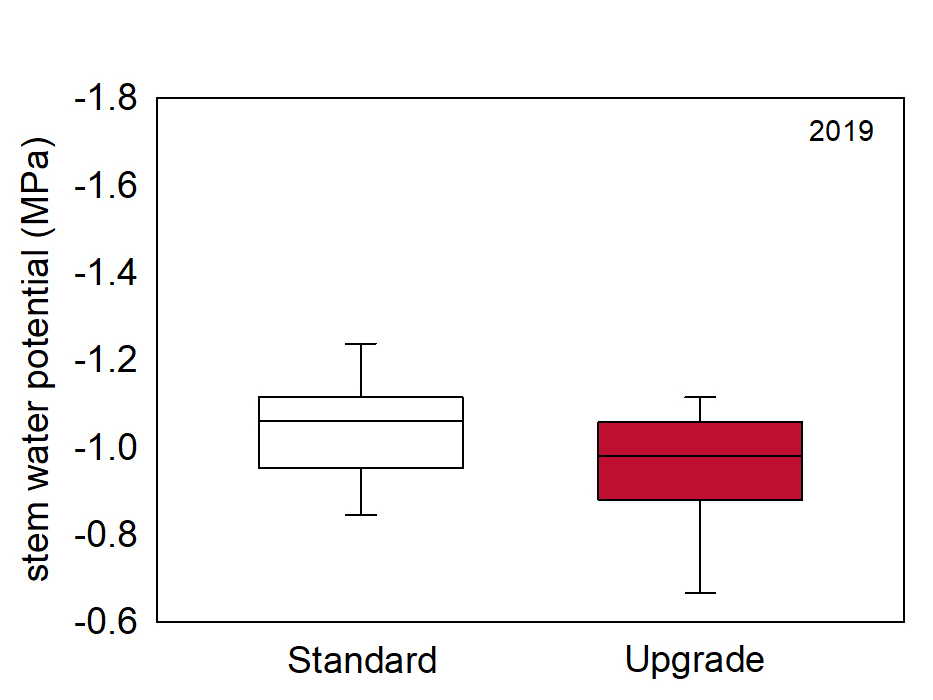
Tree water limitation is measured by using a pressure chamber to measure stem water potential. Water within the plants moves through a network of cells (xylem) that act like pipes carrying water from the roots. When the soil dries and the roots cannot keep pace with evaporation from the leaves the water in the plant becomes under tension. Tension under -1.2 MPa is considered too high.
A pressure chamber was used to measure water tension from 9 trees in July 2018, and 6 in August 2019 and 2020 along the top of the hill in the block near to solar noon. Measured leaves were bagged with silver reflective bags for at least one hour to equalize leaf and xylem water potential before measurements were taken.
Water limitation measured by stem water potential was lower in the upgraded block varying from -0.79 to -1.13 MPa compared to -0.81 to -1.7 MPa in the standard block at the top of the hill in July 2018; from –1.12 to –0.6 MPa in the upgrade compared to –1.25 to –0.84 MPa in the

standard in August 2019; and from –1.36 to –0.51 MPa in the upgrade and –1.96 to –0.8 MPa in the upgrade on in August 2020 (Figure 5). Of note is the grower ran the upgraded system the same number of hours in 2019 as the standard system and there was less stress in the upgraded system. Additionally, soil moisture information from the sensors influenced grower watering decisions in the standard block, likely helping to reduce tree stress in the standard system in 2019 and 2020.


Impact on Fruit Size and Returns
Impacts of treatments on fruit were measured from 20 fruit harvested from 8 trees in 2018 and 6 trees in 2019 in a grid pattern across the top and bottom of plots. Fruit were stored for 12 weeks and then evaluated for size and quality.
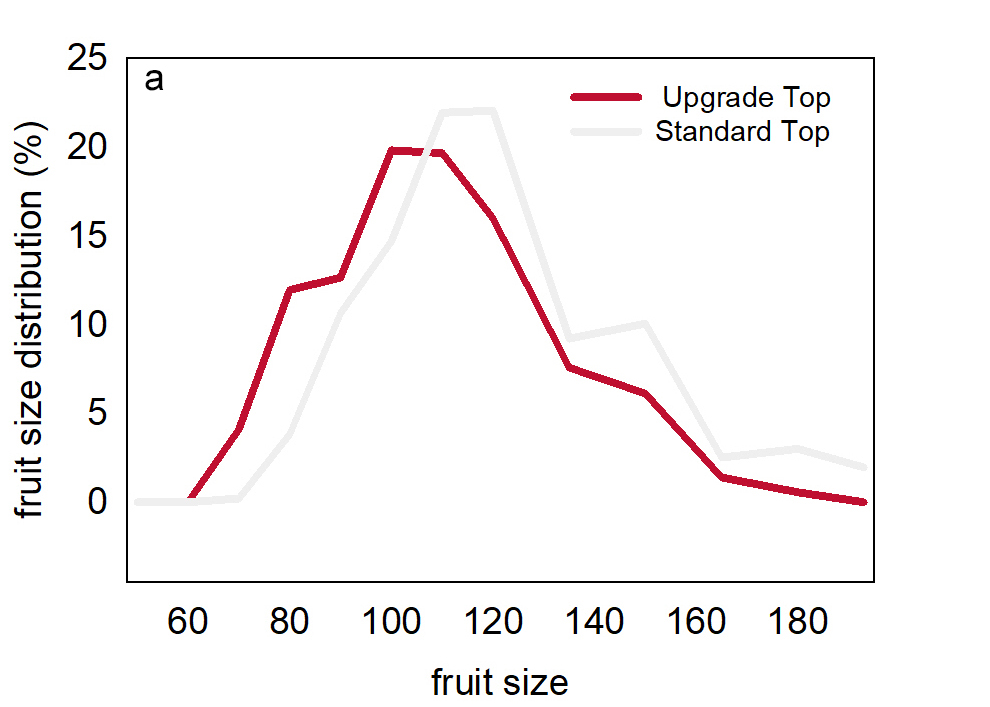
Fruit size was more uniform in the upgraded block compared to the block irrigated using the standard system. In the standard block fruit weight measured the week of harvest was generally smaller at the top of the hill compared to at the bottom of the hill. In the upgraded block fruit size was uniform between the top and bottom of the hill with size similar to the top of the hill in the standard block (Figure 6). At the top of the hill the fruit size distribution in the upgraded block tended toward larger fruit than in the standard block (Figure 7).

Fruit quality was also compared based on commercial packing of 56 bins run in each of the side by side blocks. The percentage of fruit packed varied a small amount between blocks and primarily due to factors unrelated to irrigation, e.g. cuts and limb rub.
In 2018 the packout for the upgraded block was 95.6% compared to 92.7% for the standard system resulting in 23 vs 22 packs per bin. 1.5% of the fruit in the upgrade was rated a cull due to small fruit or cork and 2.0% in the standard system. 2.9% (upgrade) and 5.3% (standard) were culled due to stem puncture, scuffing, decay etc. In 2019 the packout for the upgraded block was 92.1% compared to 93.7% in the standard block. 1.9% of the fruit was rated as cull due to small size or cork in the upgrade and 1.7% in the standard. In 2020 the pack out for the upgraded block was 91.9% and 91.0% in the standard. 0% of the fruit in the upgraded block was downgraded for cork or small size and1.0% of the fruit in the standard block was downgraded.


Returns were calculated for each irrigation system using average prices compiled by the Pear Marketing Association (Focht 2021) for each size class for the 2018/19 to 2020/21 crop years and fruit measurements from field collections at the top and bottom of the hill in Standard and Upgrade blocks. An average packing charge of $13.50 per box was assumed and using a standardized yield of 56 bin per acre and a bin weight of 1100 lbs.
A larger number of fruit in the 60 to 100 size classes which have a higher return at the top of the hill in the Upgrade block increased revenue from those sections of the block. Increased revenue was estimated at $1,309 per acre based on these measurements (Table 4).
It is important to note that revenue differences were not consistent based on commercial packouts. This appears to be due to differences in frost marking and stem punctures likely unrelated to irrigation systems.
Table 4. Effect of irrigation upgrade on revenue estimates.

ξSize estimates from fruit hand harvested the week before commercial harvest. Average of 2018 to 2020 crop years.
ϔ Using a standardized yield of 56 bin per acre and a bin weight of 1100 lbs.
‡Average pricing information source Pear Marketing Association, Brian Focht. FOB = free on board, wholesale price per box paid to warehouse.
Orchard B Case Study
Site Challenges
- Cork
- Insufficient change in elevation between the irrigation canal and the block resulting in extremely low pressure at the top of the block.
- Multiple types of irrigation sprinkler heads used in the block created uneven water distribution.
Standard System
The block is approximately five acres located on a moderate slope (Figure 8). Multiple types of irrigation sprinkler heads were used in the block (Figure 9). Due to lack of pressure at the top of the hill and variation in sprinkler heads used throughout the block trees received insufficient and uneven irrigation (Table 8) likely resulting in increased cork spot.
Figure 1. Hargrove Flowery Divide Block


| Table 7. Standard System Description | |||||
| Sprinklers per acre | GPM* | GPH per acre | Efficiency | Inches per hour | |
| Standard | 76 | 50 | 3025 | 0.6 | 0.07 |
|
Table 8. Standard System Sprinkler Pressure and Flow |
|||||
| Top | Middle | Bottom | Average | Variation | |
| PSI | 9 | 16 | 20 | 15 | 150% |
| GPM | 0.5 | 0.7 | 0.8 | 0.7 | 60% |
System Upgrade
In order to increase pressure to sufficient levels and provide even outputs across the block a small booster pump was installed at the canal and R10 micro-sprinklers with flow regulators were installed in ‘upgrade’ portions of the block (Figure 3). Resulting pressure and flow changes increased irrigation output (Table 3).


| Table 9. Upgrade System Description | |||||
| Sprinklers per acre | GPM* | GPH per acre | Efficiency | Inches per hour | |
| Upgrade | 75 | 75 | 4500 | 0.75 | 0.12 |
Impact on Soil Moisture
The system upgrade at orchard B was designed to improve the distribution of water. The standard system was providing insufficient water at the top of the hill due to insufficient pressure to run the sprinklers installed and distribution was uneven due to multiple types of sprinkler heads across the field. A booster pump increased pressure and flow at the top of the hill in the upgraded system. And installation of standardized sprinkler heads made water distribution even across upgraded sections of the block. System upgrades were completed Jun 19, 2020. The soil moisture sensors at the top of the hill were originally installed in areas blocked to irrigation by the trees and moved on
July 17. Due to non-representative early readings soil moisture interpretation is difficult. During the critical fruit sizing period in August soil moisture at the top of the hill appeared to be higher in the upgraded system.
Impacts on Tree Stress
Stem water potential measurements were made during a hot period at the end of August 2020 from six trees per plot in the upper and lower sections of the block where they were either upgraded or were equal to the standard system.
Water limitation measured by stem water potential was lower and less variable in the areas of the orchard with an upgraded system (-1.25 MPa to –0.35) compared to the standard system (-1.96 to –0.68 MPa) measured in August 2020 (Figure 13). Narrow distribution of stem water potential and thus water limitation is important for uniformity in the block.

Impacts on Fruit Size and Quality
Fruit size was measured in the field in late August 2020 before harvest from six representative trees in the upper and lower elevations of each treatment.
Fruit size was slightly larger on average in the upgraded section of the block than the standard section of the block (average 5.7 versus 5.6 oz). However, in the upgraded sections of the block trees had smaller fruit in the upper elevation of the block than in the lower section (Figure 14). This may be due to problems with irrigation sensors early in the season which led to inaccurate readings and thus non-ideal irrigation sets at a critical timing.

Orchard C Case Study
Site Challenges
- Severe cork.
- Did not pick block in 2017 due to 80% cork.

Standard System
Impact sprinklers (Rainbird and R2000) on 24 foot by 20 foot spacing. Grower’s standard irrigation was 12 to 24 hour sets weekly.
| Table 10. System Description per Acre | ||||
| Sprinklers per acre | GPM* | GPH per acre | Efficiency | Inches per hour |
| 91 | 1.08 | 5881 | 0.8 | 0.17 |
*Per sprinkler head.

Upgrade
Sentek soil moisture sensors were installed in April 2019. Irrigation in 2019 in the ‘upgrade’ block was done according to soil moisture needs rather than a standard schedule.
Impact on Water Use
| Table 11. Per Acre Water Use | |||||
| Year | Standard | Upgrade | Savings | ||
| hrs | gal | hrs | gal | gal | |
| 2019 | 120 | 705672 | 108 | 635105 | 70567 |
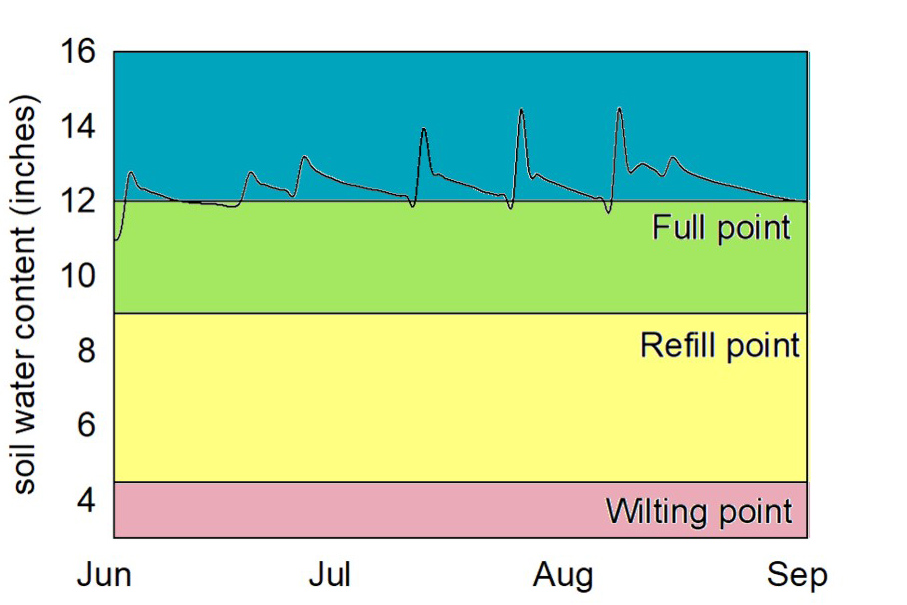
Soil Moisture
Moving to fewer 24 hour sets and using soil moisture information kept soil moisture between the refill and full points in both blocks in 2019 and 2020 (Figure 25).

Water Use
In 2019 72 hours of irrigation was applied during the 15 week irrigation season. If 24 hour sets had been used approximately 144 hours would have been applied. A standard set length of 12 vs 24 hours reduced water use by an average of 343,821 gallons per acre over the course of the season (Table 8).


Orchard D Case Study
Site Challenges
- Cork
- 2017 29% pack out with 52% cork.

STANDARD SYSTEM Impact sprinklers with 50 sprinklers per acre at block P and 39 sprinklers per acre at block W (Figures 21-24).
UPGRADE 3 acres were switched from Rainbirds to Nelsons. Soil moisture sensors were installed in April 2019. Irrigation in the ‘Upgrade’ block was done with fewer 24 hour sets starting in 2018. The grower waited longer between sets and reduced 24 hour sets based on sensors starting in 2019.
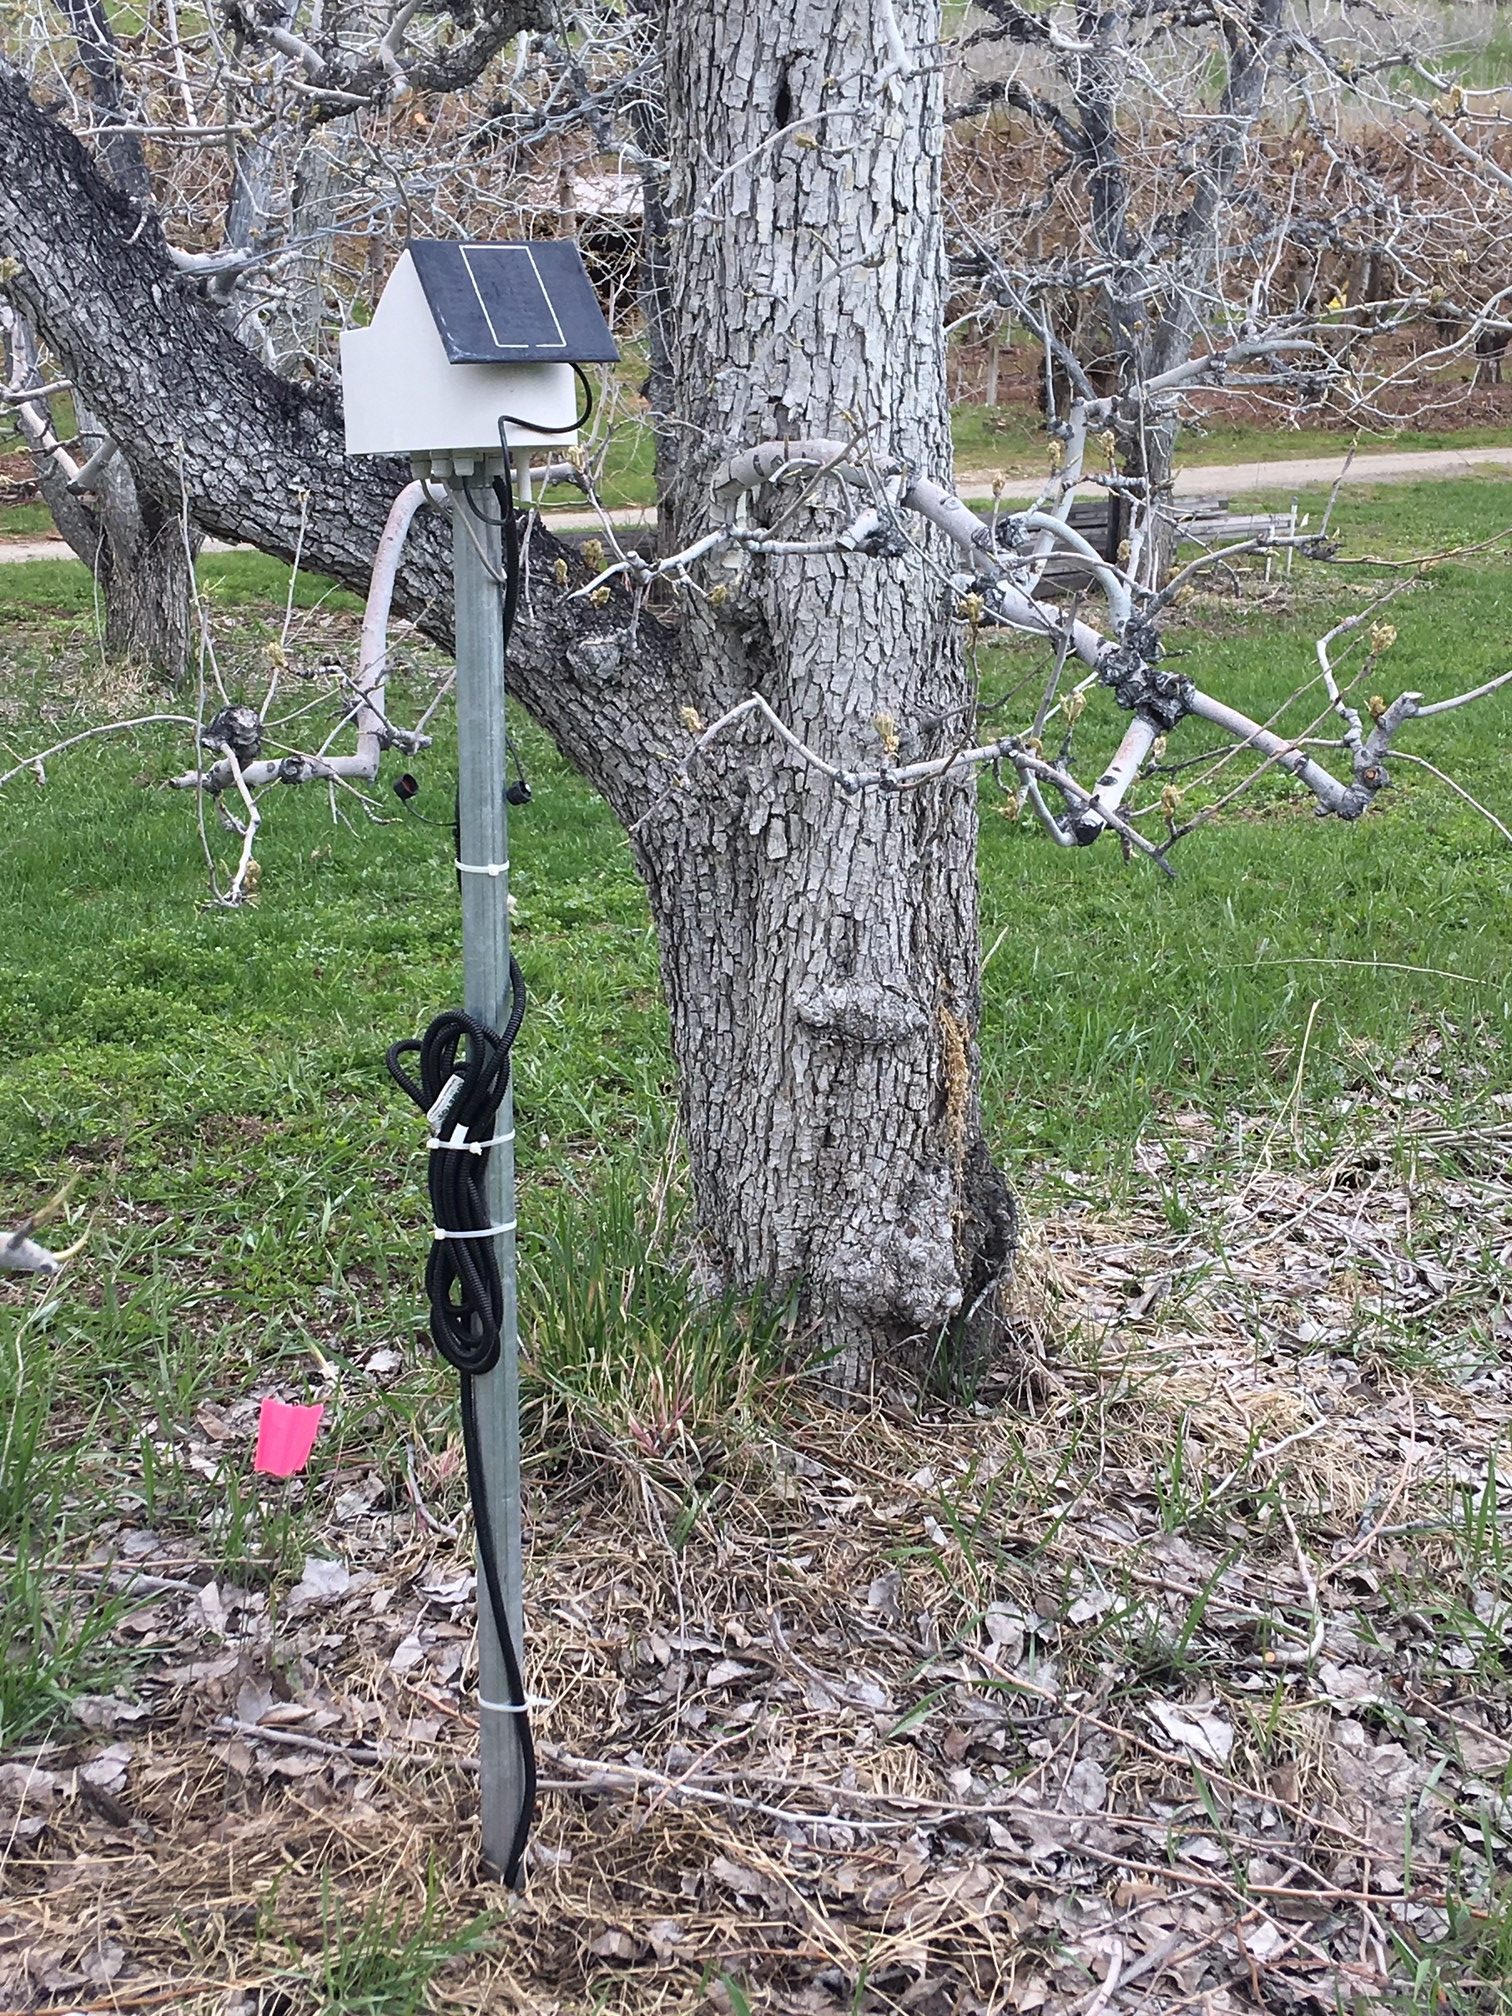
Real Time Soil Moisture Information

Figure 22. Rainbird sprinklers (pictured) and R2000 sprinklers were standard at this site.

The irrigation sensor provided soil moisture information updated hourly. The interface shows soil moisture levels relative to field capacity and maximum allowable depletion levels input by the user (Figure 23). Levels are displayed as an average and for 8, 12 and 24 inch depths. See ‘Using Soil Moisture Sensors in Pears’ for more sensor information.


| Table 7. Water use per acre. | ||||
| Year | Block W | Block P | ||
| hrs | gal | hrs | gal | |
| 2019 | 72 | 343821 | 60 | 336600 |
| 2020 | 167 | 796519 | 178 | 999141 |
| 2019: May 13 to Aug 19 (15 weeks) | ||||
| 2020: May 4 to Aug 31 (18 weeks) | ||||
| Table 8. Water savings of moving to a 12 versus 24 hr set | ||||
| 24 hr set | 12 hr set | Savings | ||
| hrs | gal | hrs | gal | gal |
| 144 | 687642 | 72 | 343821 | 343821 |
Impact on Tree Stress
While soil moisture as measured by the irrigation sensors was generally between the full and refill points, tree stress as measured by stem water potential was high in block P in 2019 and in both block W and P in 2020 at the date of July measurements (Figure 26).


Impact on Fruit Quality
Fruit quality was measured from commercial pack-outs from orchard blocks before and after irrigation changes were made.
After the irrigation change was made in 2018 downgrades from cork dropped on average. In 2017 before irrigation changes were made the packout was 61% and 73% for block W and P respectively with 29% and 52% cork resulting in 4,250 and 5,240 lbs per acre of culls due to cork for block W and P respectively (at 40 bins per acre). After the grower moved from a standard of 24 hour sets to 12 hour sets and used irrigation sensor information to lengthen the time between sets , culls per acre from cork in Anjou pears dropped to an average of 1,575 and
1,312 lbs per acre of culls due to cork for block W and P respectively (at 40 bins per acre) (Figure 27). A reduction in culls due to cork translates to increased returns. Assuming $20 per 44 lb box and 40 bins per acre, revenue lost to cork culls was $1,932 and $2,382 per acre for block W and P respectively in 2017. After the move to 12 hour sets, lost revenue to culls averaged $716 and $596 per acre for block W and P respectively between 2018 and 2020 (Figure 28). It is important to note that weather and other year-to-year differences could also have influenced cork, pack-out and revenue changes. Additionally the orchardist took over management of the block in 2017 and more aggressive pruning and other horticultural practices likely impacted the fruit quality over time.


Orchard E Case Study
Challenge
Clogging irrigation filters can result in reduced pressure and consequent reduction in water applied to a block.
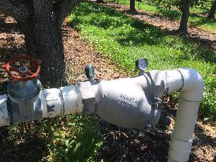
Site Description
The site has a standard filter out of the irrigation canal (Figure 29) and a standard Sontag filter before the block (Figure 30). Brush filters that can be cleaned without opening are also used on the farm in other blocks (Figure 31).


Measurements
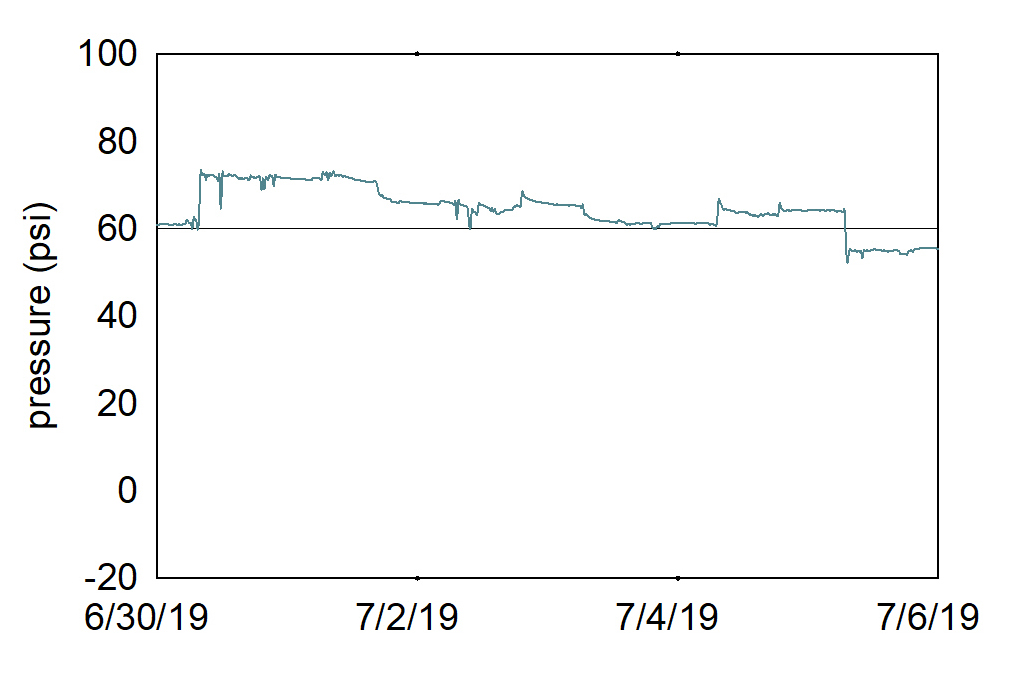
A pressure gauge with a data logger was installed on the filter at the beginning of the growing season in order to track potential drops in pressure when filters clog (Figure 32). Pounds per square inch of pressure was measured every 15 minutes continuously from May 23 to August 15, 2019. In June the irrigation system was often turned off, especially at night, due to the wet spring which meant watering was not always necessary. Water pressure dropped over night occasionally during peak irrigation season of July (Figure 33). For example, on July 19 pressure dropped to 42 PSI at 6 am presumably before the filter was cleaned at 7 am and pressure returned to 62 psi. However, it is unclear whether pressure drops were significant enough to produce substantially reduced irrigation outputs.


Additional Information
Using Soil Moisture Sensors in Pears. DuPont, S.T., Peters, T., Kalcsits, L. 2021. Washington State University. https://treefruit.wsu.edu/article/moisture-sensors-pears/
References
McCutchan, H., & Shackel, K. A. (1992). Stem-water potential as a sensitive indicator of water stress in prune trees (Prunus domestica L. cv. French). Journal of the American Society for Horticultural Science, 117(4), 607-611.
Mitchell, P. D., Van de Ende, B., Jerie, P. H., & Chalmers, D. J. (1989). Responses of ‘Bartlett’ pear to withholding irrigation, regulated deficit irrigation, and tree spacing. Journal of the American Society for Horticultural Science (USA).
Shackel, K. A., Ahmadi, H., Biasi, W., Buchner, R., Goldhamer, D., Gurusinghe, S., … & McGourty, G. (1997). Plant water status as an index of irrigation need in deciduous fruit trees. HortTechnology, 7(1), 23-29.
Strohm, C., 2018. Survey of Four Packing Houses in Washington Representing 500 million pounds of fruit 2015-2017. Washington State University unpublished.
Raese, J. T., Brun, C. A., & Seeley, E. J. (1982). Effect of irrigation regimes and supplemental nitrogen on alfalfa greening, cork spot, and fruit quality of’d’Anjou’pears. HortScience.
Thank you to support from
Larry and Renee Caudle, Erica Bland, Brandon Long, Aaron Hargrove, Phil Guthrie, and Bob Gix.
WSU Extension ![]()
Wilbur Ellis
Sentek Technologies 
Bonneville Environmental Foundation 
Cascadia Conservation District ![]()
Fresh Pear Committee