Written by Bernardita Sallato, WSU Tree Fruit Extension Specialist. Updated June 2021.
Introduction
Analyzing leaf tissue is one of the most valuable and standardized tools to diagnose nutrients and/or monitor the nutritional status of any orchard. To effectively evaluate leaf tissue nutritional analyses, it is important to understand what it can and cannot tell us, and how to interpret results.
What tissue analysis can tell us
- Which elements are present in adequate, deficient or excessive amounts (Marschner 2002, Hart et al. 1997).
- What nutrients were taken up.
What tissue analysis cannot tell us
- Why the nutrients are deficient or excessive.
- How much we should apply.
- What material we should apply.
Tissue analyses are, therefore, a useful guide to monitor your nutrient management program, identify an uptake problem and/or detect toxicities. For a complete diagnostic process, compliment your tissue tests with additional tools, such as: soil testing, observation of vigor, historical management, water quality and quantity.
How to interpret the information
To be able to interpret a laboratory test, you need either to compare the results against a standard or, in the case of troubleshooting, compare between areas: for example. healthy and weak.
Utilizing standards: When you are monitoring your nutrient management program and overall nutrient status of the orchard, we recommend comparing your results with a validated standard (see Table 1.
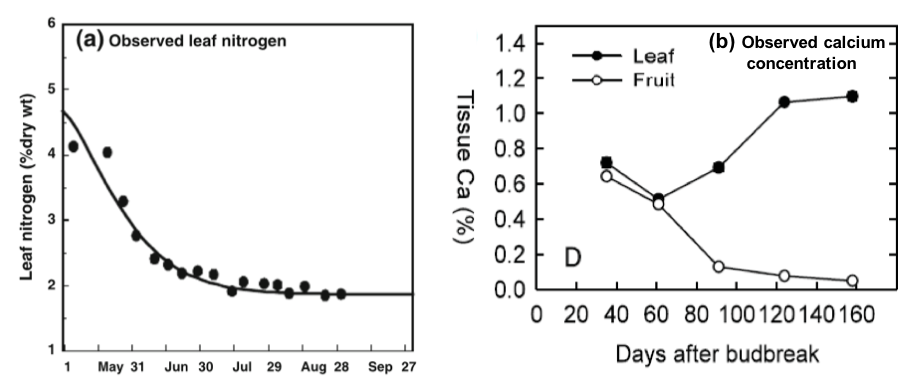
Standards were developed to be utilized as a reference for adequate nutrient status under different growing conditions. Nutrient concentration varies among tree fruit tissues and changes over the season (Figure 1). Standards must be sensitive enough to clearly alert when nutrient levels become deficient or excessive, but also be stable. The most sensitive indicators reported for nutrient status are leaf and sap analyses.
Analyses of sap nutrient content can be useful for determining nutrient levels at a moment in time. However, sap nutrient content is highly variable due to growth stages, time of day, environmental conditions, and fertilizer applications. Thus, there are no validated standards for sap nutrient content in tree fruit and values are not indicate deficiency or toxicity.
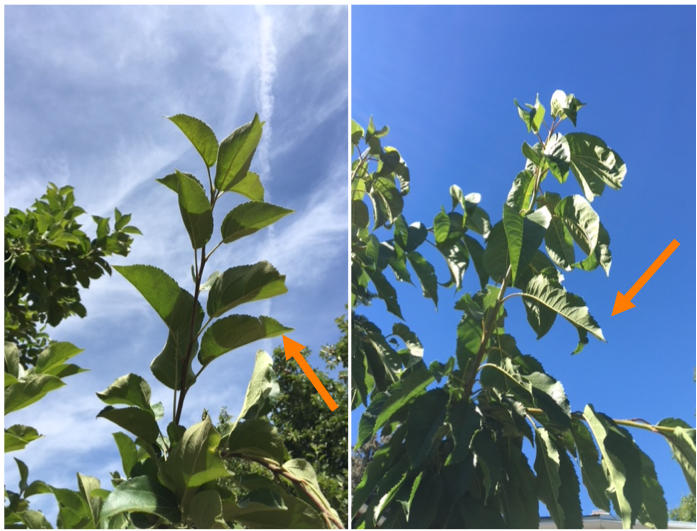
In contrast, leaf tissue sampling has been identified as the most validated indicator of tree fruit nutrient status and cost effective, having the best compromise between sensitivity and stability for most mineral elements. The most stable nutrient concentration has been determined to be on recently mature leaves from nonbearing spurs or new shoots, obtained between the end of active shoot growth and nutrient relocation to shoots and roots (Figure 2). Recently mature leaves can normally be obtained during July through August. Table 1 shows validated leaf tissue standards for nutrient absorption and overall nutrient status for different tree fruits.
Table 4. Leaf tissue standards for recently mature leaves in different tree fruit species
| Nutrient | Unit DW | Applea,c,d,e | Peara,c,d,e | Cherryb | Peachb | Apricotsa,b |
|---|---|---|---|---|---|---|
| Nitrogen (N) | % | 1.7 – 2.5 | 1.8 – 2.6 | 2.00 – 3.03 | 2.7 – 3.5 | 2.4 – 3.3 |
| Phosphorous (P) | % | 0.15 – 0.3 | 0.12 – 0.25 | 0.10 – 0.27 | 0.1 – 0.30 | 0.1 – 0.3 |
| Potassium (K) | % | 1.2 – 1.9 | 1.0 – 2.0 | 1.20 – 3.3 | 1.2 – 3.0 | 2.0 – 3.5 |
| Calcium (Ca) | % | 1.5 – 2.0 | 1.0 – 3.7 | 1.20 – 2.37 | 1.0 – 2.5 | 1.10 – 4.00 |
| Magnesium (Mg) | % | 0.25 – 0.35 | 0.25 – 0.90 | 0.30 – 0.77 | 0.25 – 0.50 | 0.25 – 0.80 |
| Sulfur (S) | % | 0.01 – 0.10 | 0.01 – 0.03 | 0.20 – 0.40 | 0.2 – 0.4 | 0.20 – 0.40 |
| Copper (Cu) | mg/Kg | 5 – 12 | 6 – 20 | 0 – 16 | 4 – 16 | 4 – 16 |
| Zinc (Zn) | mg/Kg | 15 – 200 | 20 – 60 | 12 – 50 | 20 – 50 | 16 – 50 |
| Manganese (Mn) | mg/Kg | 25 – 150 | 20 – 170 | 17 – 160 | 20 – 200 | 20 – 160 |
| Iron (Fe) | mg/Kg | 60 – 120 | 100 – 800 | 57 – 250 | 120 – 200 | 60 – 250 |
| Boron (B) | mg/Kg | 20 – 60 | 20 – 60 | 17 – 60 | 20 – 80 | 20 – 70 |
Adapted from:
a Shear and Faust, 1980;
b Reuter and Robinson, 1997;
c Righetti et al., 1990;
d Silva and Rodriguez, 1995;
e Penn State University, based on July-August sampling of mature leaves.
Importantly, these established standards have shown to be valid irrespective of cultivar, rootstock, training system, and environmental conditions. However, for ‘Honeycrisp’, Cheng (personal comm) recommends managing N and K within the lower levels of the recommended range for apples.
Comparing samples/Troubleshooting: In some cases, when trying to determine if a problem is due to plant nutrition, samples can be taken at any time during the season from healthy and weak or problematic areas. In this case, the tissue, age, or position can be different from the standard protocol, as long as the sampling procedure remains consistent for the parts of the orchard being compared. Note that when leaves have severe symptoms of deficiency or toxicity, nutrient levels become less predictive.
Additionally, under comparative circumstances or experimental trials, other complementary analyses as sap analyses, such fruitlets and soil chemical analyses should be utilized for an integrated analysis.
Sampling considerations
When utilizing a standard, strict but simple protocols should be followed, which can vary between different species. For most tree fruit species, a recently mature leaf sample should be taken from the middle of a non-bearing shoot or non-bearing spur, from mid-canopy, typically during July – August (See Fig. 2).
Make sure to collect enough samples that represent the area that you want to analyze. The general recommendation is 50 leaves in a maximum of 10 acres if the block is fairly homogeneous. Do not mix different species, cultivars, young and old blocks. Do not sample from too old or too young leaves, too vigorous or weak shoots, or dirty tissue that show things like insect or bird droppings. Samples should be collected at least 15 days after a foliar nutrient spray, or take into account the latest spray application when interpreting the results. In addition, some pesticides or protectants might contain mineral elements such as Zn, Cu, S, Ca and/or B. If it is not possible to avoid recently sprayed leaves make sure the laboratory knows about the condition, so they pay extra attention in processing the sample and keep it in mind when interpreting the results.
Samples should be collected in paper bags to avoid condensation. Keep cool before sending to the laboratory. Label each sample properly according to the laboratory requirements and submit within 24 hours of sampling.
Where to send the samples
There are many good laboratories in Washington and Oregon. Make sure the laboratory follows the methods recommended for leaf tissue analyses and that the laboratory participates in the North American Proficiency Testing (NAPT) program. This program is managed by the Soil Science Society of America and assists laboratories in their performance through inter-laboratory sample exchanges and statistical evaluation of the analytical data. The list of accredited laboratories is updated annually (Accredited laboratories for 2022).
Recommended test
A complete analysis includes: Total N, P, K, S, B, Ca, Mg, Zn, Mn, Cu, Na.
Depending on the soil type or limiting conditions, some analyses might be more important to monitor than others. Under low pH conditions, aluminum (Al) can be included if high Al in the soils is suspected. Under salinity, chloride (Cl) should be included to monitor if salts are excessive. Total foliar iron (Fe) has shown little correlation with Fe uptake. For Fe deficiency, soil pH and visual chlorosis are better indicators.
General guidelines for leaf analyses interpretation
Nitrogen (N)
| Leaf analysis | Additional information | Recommendation |
|---|---|---|
| High | If high vigor | Reduce dose |
| High | If low growth and N concentration | Verify other growing factors (water, light, biotic stresses) |
| Low | If low vigor – chlorosis | Increase dose |
| Low | If high vigor and N dilution | Reduce dose |
Phosphorous (P), Potassium (K), Calcium (Ca), Magnesium (Mg), Sulfur (S)
| Leaf analysis | Additional information | Recommendation |
|---|---|---|
| High | If high in soils | Reduce dose |
| High | If low in soils | Check spray program Check possible contamination |
| Low | If high in soils | Check absorption problems in root zone (pH, water, pathogens, etc.) |
| Low | If low in soils | Increase dose |
Boron (B), Zinc (Zn), Copper (Cu)
| Leaf analysis | Additional information | Recommendation |
|---|---|---|
| High | If high in soils | Reduce or suspend fertilization |
| High | If low in soils | Reduce or suspend sprays Verify contamination/ presence in sprayed products |
| Low | High in soils | Check pH – under alkaline soils (pH > 7). Rely on foliar spray |
| Low | Low in soils | Correct soil levels. Complement with foliar spray. |
Manganese (Mn)
| Leaf analysis | Additional information | Recommendation |
|---|---|---|
| High | High in soils | Check soil water / drainage condition. Under anoxia, Fe and Mn becomes more available. |
| High | Low in soils | Check spray program Check contamination |
| Low | High in soils | Check pH – under alkaline soils (pH > 7). Rely on foliar spray |
| Low | Low in soils | Correct soil levels. Complement with foliar spray. |
Iron (Fe)
| Leaf analysis | Additional information | Recommendation |
|---|---|---|
| Low or high | – | Total Fe is not a good indicator for Fe status. Best indicators are visual symptom of chlorosis and soil pH. |
The information above is a general interpretation of the guidelines. To develop a nutrient management program or diagnose an orchard condition, an integrated analysis should be made, utilizing additional diagnostic tools such as soil analyses, visual diagnosis in-field, and historical management.
Contact

Bernardita Sallato
WSU Tree Fruit Extension Specialist
Prosser-IAREC
b.sallato@wsu.edu
Other References
Crassweller, R. It’s Time to Evaluate the Nutritional Status of Fruit Trees. Web page link
Cheng, L. and R. Raba. 2009. Nutrient Requirement of Gala/M.26 Apple tree for high yield and quality. Cornell University.
Hardman J.M., W. Van der Werf, S. Blatt, J. Franklin, R. Karsten and H. Teismann. 2013. Simulating effects of environmental factors on biological control of Tetranychus urticae by Typhlodromus pyri in apple orchards. Experimental & Applied Acarology. 60. 10.1007/s10493-012-9640-z.
WSU Tree Fruit Extension articles may only be republished with prior author permission © Washington State University. Reprint articles with permission must include: Originally published by Washington State Tree Fruit Extension at treefruit.wsu.edu and a link to the original article.
