By Gwen Hoheisel, WSU Regional Extension Specialist
The idea behind any pesticide application is to get every drop to the crop. Spray or drift that goes into the air clearly missed the target leading not only to negative environmental and health effects, but also a waste of money. Pesticide applications are the most frequent operation carried out in the orchard or vineyard, and chemical control is the second highest cost of production (i.e., pre-harvest operations) in orchard systems with material costs for a single spray ranging from $40 to > $100/acre depending on the crop and chemical (Freeman et al., 2008). So any waste, or improvement, can have a significant economic impact. .
Proper maintenance and operation of a sprayer is the first step in optimizing spray quality. This article will discuss 6 steps to calibrate and optimize sprayer output. However, there is an assumption that the mechanical parts of a sprayer—like the hoses, pressure gauges, pumps, and agitators—are working properly.
Optimizing spray applications takes time initially, but will pay off with better coverage, improved pest control, and less culls.
Step 1. Check Speed
Speedometers on tractors, especially old ones, are notorious for being inaccurate. Having an accurate speed is important because it is used in the subsequent calibration steps and effects good coverage. Always check speed in the field as opposed to a gravel road, since the terrain influences speed. There are two ways to assess speed.
Method 1: Manual check
In the orchard, mark a 100-foot path with two stakes. With a stopwatch, record the time it takes for the front tire of the tractor to pass from one pole to the next. Use this formula to check the speed
Other distances (i.e. 88 or 200 feet) can be used for the path. Longer paths, over more terrain, could eliminate some variation in time due to hills or dips. Creating 2-3 paths also eliminates variation. If three 100-foot paths are timed, simply take the average of all times and then calculate miles/hour.
Method 2: Use a tool
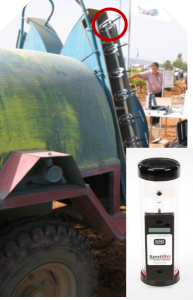
GPS technology can give an accurate assessment of speed. Options include purchasing a gps unit from a local spray manufacturer or using a hiking/biking gps device or mobile phone app. Hiking or biking apps allow for better resolution at low speeds (ex. 3.2mph). Additionally, many of these tools have an option to map the route and rows sprayed.
In the orchard, start the gps or app. Set a desired gear and throttle with the PTO on. Drive down a row for 20-30 seconds and look at the speed. If needed, change gears to obtain the desired speed, each time allowing 20-30 seconds for a proper reading on the gps

Step 2. Adjust the Direction of the Air
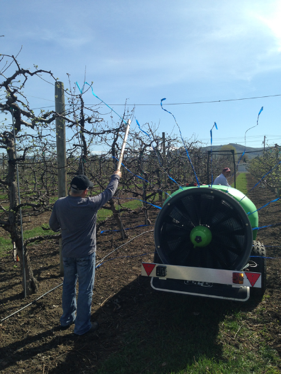
Air carries the spray droplets, meaning wherever air goes, droplets will follow. Therefore, it is critical to direct the air into the canopy or adjust for air that cannot be re-directed. Using flagging is a fast and inexpensive way to see the direction of air flow.
- Park the sprayer in the row.
- Tie ribbon (~2-feet long) to every other nozzle body and onto the ends of deflectors (if present) using clips. Ribbon can also be tied to the end of a stick to extend the visualization.
- Turn on the air without the spray. The ribbons should orient just over and just beneath the canopy. Use deflectors to aim air (ribbons) into the canopy. Consider turning off the top and bottom nozzles if they are not spraying into the canopies.
This should be performed for EACH significantly different canopy shape. Record which nozzles are used for each planting and the deflector orientation.
Note On Deflectors: The rotation of any fan, whether on an airblast or multi-fan tower sprayers, has a different air pattern on the right versus left side. As a fan rotates in a clockwise fashion air is pushed down on the right and lifted up on the left. Reverse this for fans that rotate counter-clockwise. Bottom and top deflectors can help even the airflow between the two sides. Many airblast sprayers are missing or have too short of a deflector. Many were removed because they hit fruit, but in modern, narrower, trellised orchards, they may be useful without interfering in the canopy.
Step 3. Match the Air Volume and Speed to the Canopy
Spray should penetrate the canopy but not expel greatly from the other side. Many factors like wind, canopy density, and speed will affect the correct volume of air and ideally there should be an automated method to adjust the air volume as conditions change. However, significant improvements can still be seen with manual adjustments done just a couple times a season depending on crop growth. The steps below can be measured through the season for 1-2 years as the canopy develops and then recorded for future years.

- Tie ribbon to the top, middle, and bottom branches of the far side of the canopy from where the sprayer is driving.
- One person stands at the end of the row watching the ribbons. Drive by using typical sprayer settings.
- Adjust the sprayer according to the results:
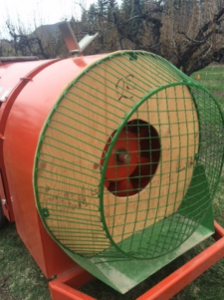
- If the ribbons blow straight out, there is too much air, which is very common early season. Some solutions include reduce fan gear from high to low, put a plywood “donut” under the fan cage, or a cloth shroud around the sides of the fan cage, drive faster, change the tractor settings to gear up and throttle down (not a good option for hills)
- If the ribbon doesn’t move, there is too little air. Solutions: drive slower, increase rpm or fan gear.
Step 4. Calculate and Record the Expected Nozzle Output
Now that the correct nozzles are used to match the air direction with the canopy shape (step 2), the gallons/minute for each nozzle can be calculated. You will need to know the running pressure in PSI and the desired gallons/acre (GPA). There are two methods that can be used calculate nozzle output.
Method 1: Manually Calculate.
Use the formula below to calculate the gallons per minute (GPM) for the entire sprayer.
If the output from every nozzle on one side is supposed to be the same, divide the GPM per side by the number of nozzles on a side (ex. GPM per side/# nozzles per side = output per nozzle). If output is different for each nozzle location, than the total output per nozzle must add to the GPM per side.
The output from each nozzle should be proportional to the canopy density that the nozzle is targeting. For example, a large open vase cherry tree may need 2/3 of the volume coming from the upper 2/3 of the nozzles while the rest of the volume comes from the lower 1/3 of the nozzles. For example if there are 9 nozzles open with a desired 6 GPM per side, then the upper 6 nozzles should put out 2/3 of the spray (3.3 GPM or 0.66 GPM for each nozzle). The remaining 3 nozzles should put out 2.7 GPM or 0.9 GPM for each nozzle. Adjustments on volume per nozzle can be made after step 6 when spray coverage is assessed.
Lastly, look in a nozzle catalog to determine the expected nozzle output in GPM for each nozzle. For disc-core nozzles, go across the top of the table to the desired operating pressure, then go down the column to find the closest output per nozzle. Last, move left along the row to see the appropriate disc-core.
Method 2: Use an app or software
Mobile phone apps (ex. VineTech), Web software (ex. Turbomist Program), and many Crop Consultant companies will calculate the total expected output from each nozzles and suggest the proper disc core. Some of the software programs also account for different canopy shapes and adjust nozzle output based on canopy density as describe in ‘Method 1’. These are great alternatives that limit manual calculations and allow for quick adjustments.
Regardless of method used, the desired output per nozzle and disc-core should be recorded.
5. Measure Nozzle Output

This step can be conducted at any time in the year to assess for worn nozzles, but it should be conducted at least once before the season begins.
- Confirm the pressure gauge is at the correct PSI.
- Connect hoses to the nozzles. Clamps that securely fit around the nozzles can be made or purchased from AAMS.
- Turn on the sprayer with water flowing. Collect the output for 60 seconds into a graduated cylinder marked with ounces. Then calculate Alternatively, use a flow meter to quickly measure output in GPM and eliminate the math.
- Any nozzle that is more than 10% off from expected should be replaced. Replace ALL nozzles if more than 2 are bad.
6. Verify Coverage
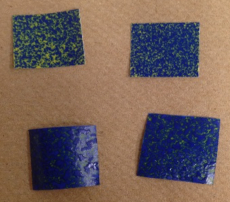
Now that air volume, spray output, and nozzle orientation are correct, confirm your coverage with water sensitive paper (WSP) which is yellow paper that turns blue with water droplets. When working with WSP, always wear nitrile gloves as the moisture in your hands turns the card blue. A large sheet (2”x3”) can be cut into 4-6 smaller squares. These can be stapled to the top, middle, bottom, inner, and outer leaves of the canopy, or any other place to determine coverage. In addition, staple or tape WSP to three 1”x2” board that is 2-4 feet long. Place these boards on the ground in the first, second and third row opposite the spray to determine how much spray drifted through the canopy onto the mid-row.

Operate the sprayer at the calibrated settings from the previous steps and drive past the trees with WSP. Look at the spray cards to assess coverage. The ideal spray coverage has many fine droplets all over the card without any long streaks of all blue. Areas with all blue mean too much material is being applied which leads to waste and material running-off the leaves.
Make adjustments to the sprayer or nozzle output based on your results. For example, if the spray card is completely blue in the bottom of the canopy, but few drops in the upper canopy, then either adjust the output of the nozzles or angle the nozzles differently to put more in the upper canopy. Alternatively if all the cards are blue including those on the ground, consider reducing your air volume and liquid spray volume.


