AgWeatherNet has unveiled an updated, intuitive interface for the Apple Pollen Tube Growth Model. The model continues to serve as a valuable tool for optimizing bloom-time chemical thinning strategies.
What’s New?
The updated interface now includes interactive charts that allow users to better visualize pollen tube growth over time, along with supporting tables that present key data in an easy-to-read format. Updated documentation is also available to help guide users through input selection, interpreting the model results, and recommended actions based on model output to make informed thinning decisions.

Figure 1. Updated interface for the model.

Figure 2. Interactive fullscreen mode enhances model result visualization.
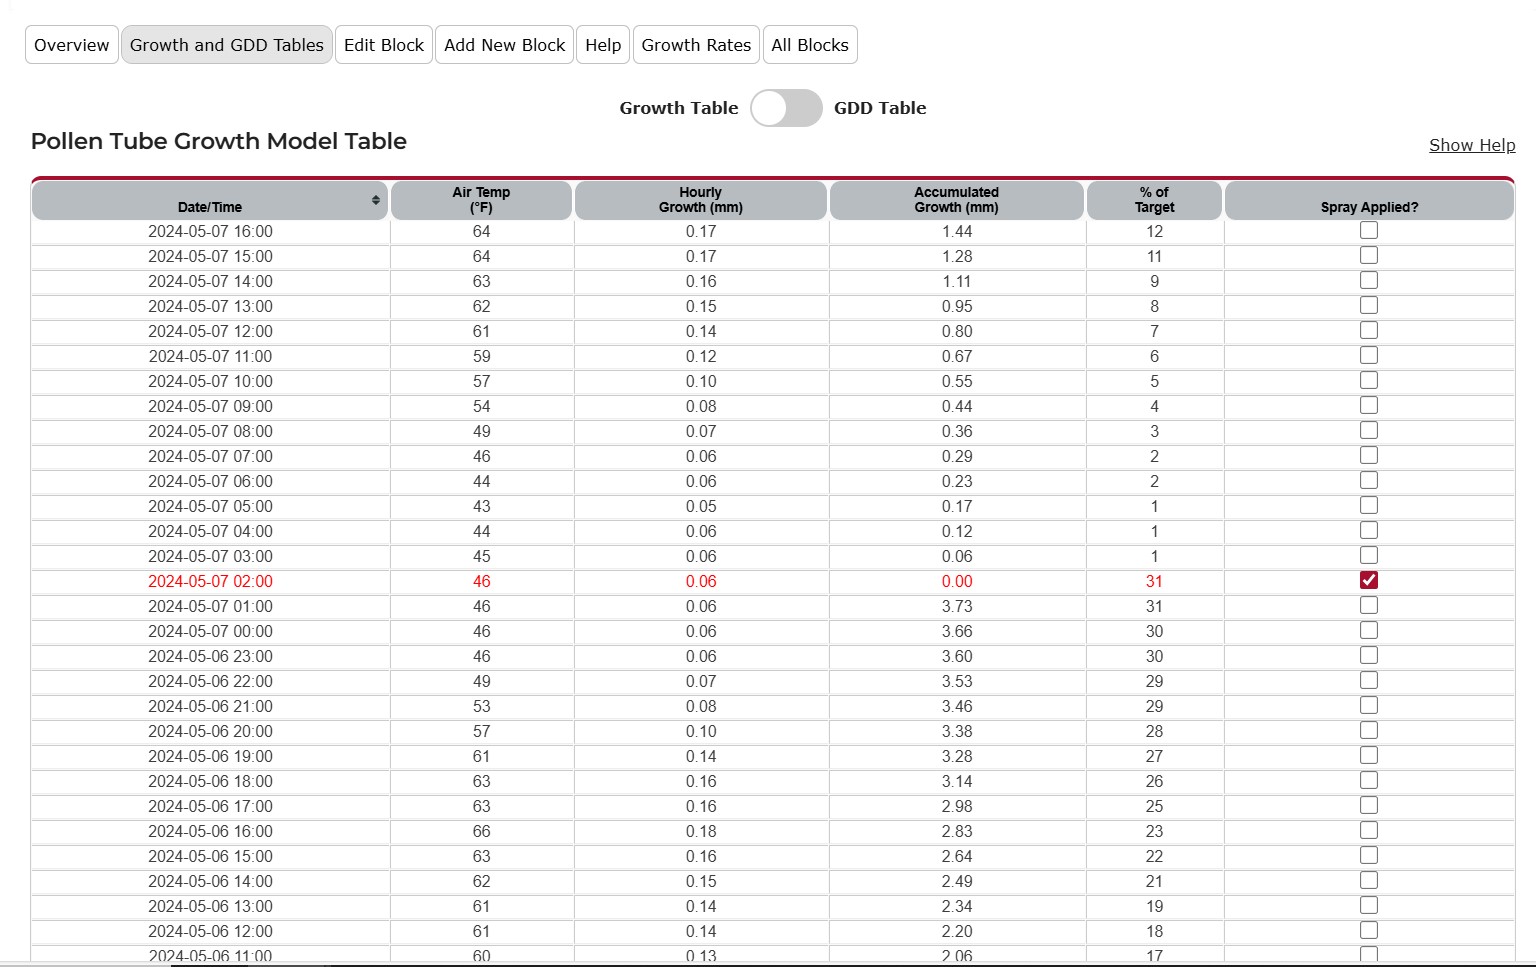
Figure 3. Styling updates to the Growth and growing degree day (GDD) tables for improved readability and usability.

Figure 4. Growth and GDD Charts now support interactive features for easier model output interpretation.
How to Access?
You can access the new interface from the Main Menu (Models –> Apple –> Pollen Tube Model) or directly via this link. For more information on how to use the Pollen Tube Growth Model, visit the Help section, or click this link.
Need Help?
Contact weather@wsu.edu for feedback or additional information about the model.
