Written by Jonathan T. Magby, Yakima Valley College (formerly WSU-IAREC), February 25, 2026
The LTER–Sweet Cherry Model v1 is a web-based decision-support tool that uses daily temperature and solar radiation inputs to generate seasonal estimates of floral dormancy progression (LTER), floral relative water content (RWC), and floral cold hardiness (LT, LT10, and LT50) for 12 cultivars and at the species level. The application provides interactive time-series visualizations designed to assist growers, researchers, and industry professionals in interpreting both seasonal bud state and potential freeze risk. Model development utilized multi-season physiological datasets collected in Prosser, Washington (2019–2022), including dormancy status, water relations, and cold hardiness measurements aligned with daily atmospheric inputs (Magby 2025). Integration within WSU AgWeatherNet is forthcoming. The current version is available at this link (opens in a new window).
Model Outputs
Dormancy Progression (LTER)
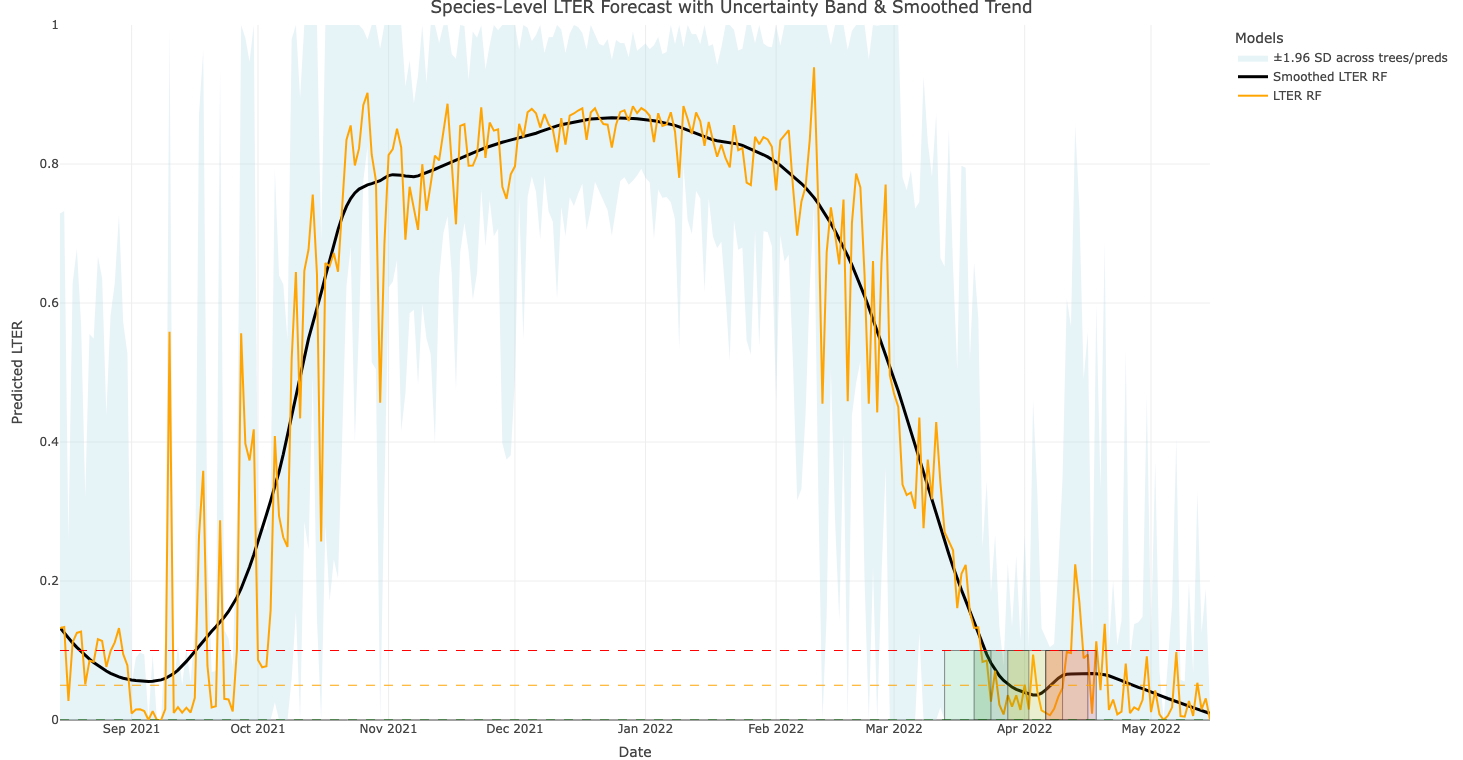
Low Temperature Exotherm Ratios (LTER) are a physiological index derived from differential thermal analysis research that reflect seasonal changes in bud dormancy status (Magby et al. 2022). Values range from 0 to 1 and reflect seasonal transitions toward spring development (Figure 1). The LTER panel displays seasonal trajectories with reference threshold lines and developmental stage windows [Green Side (l-green), Green Tip (d-green), Tight Cluster (yellow), Popcorn (orange), and Bloom (red)] to assist in seasonal interpretation.
Relative Water Content (RWC)
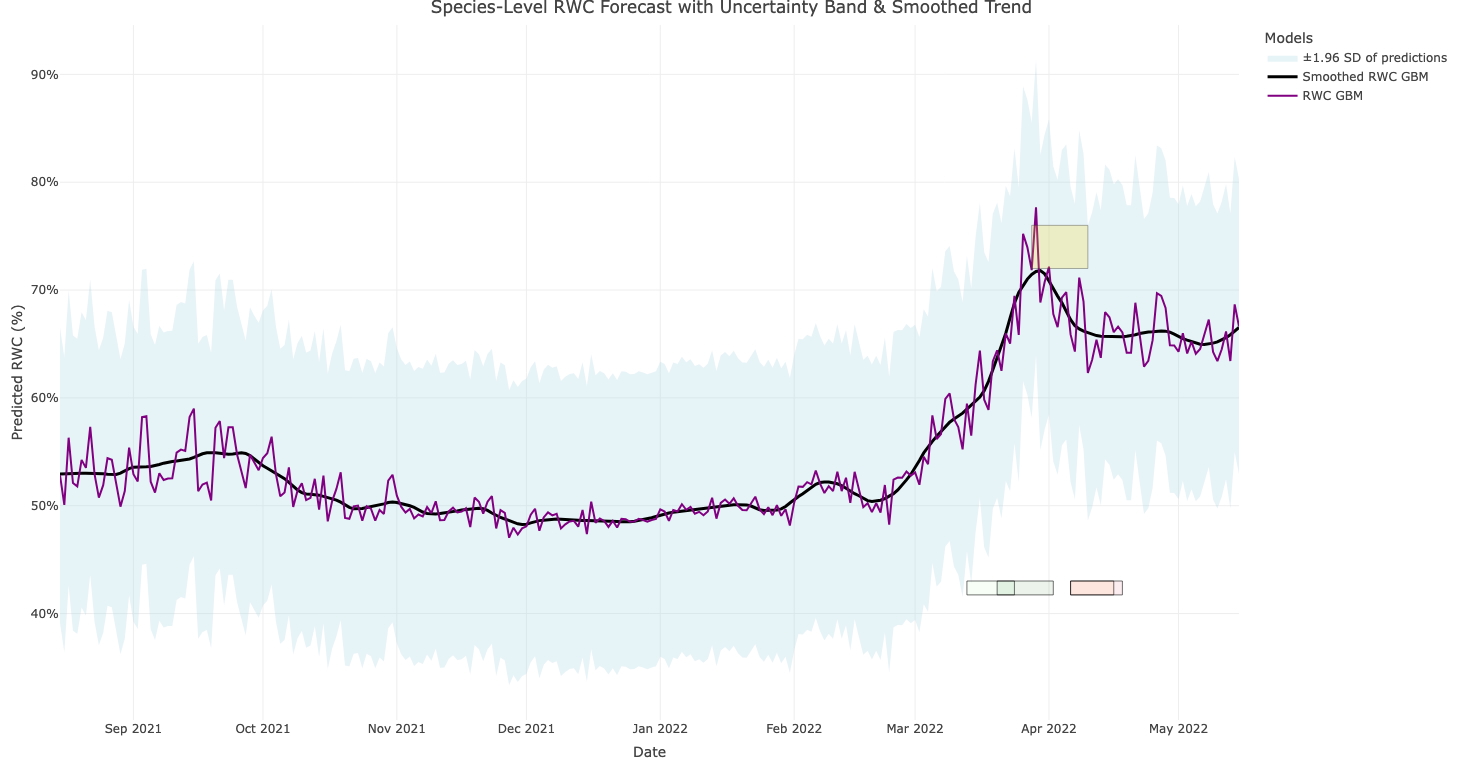
Relative water content (RWC) reflects floral bud hydration status, a physiological factor associated with seasonal development and freezing tolerance (Figure 2). The RWC panel displays seasonal trends with uncertainty bands. A Tight Cluster (yellow) reference window is included to assist with ground interpretation during spring developmental stages.
Cold Hardiness (LT, LT50 and LT10)
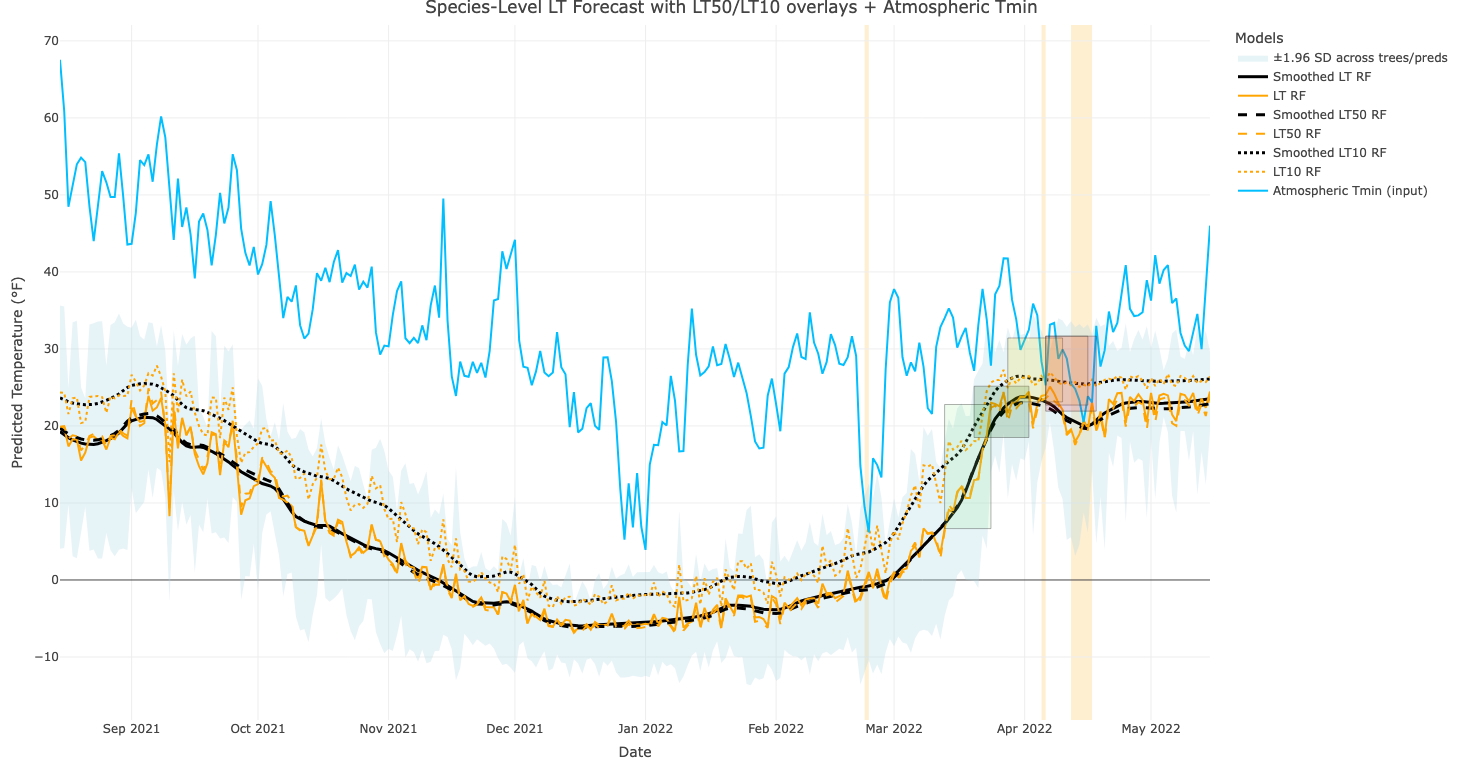
The cold hardiness panel displays predicted lethal temperature thresholds (LT, LT10, LT50) with optional Tmin overlay for freeze-risk interpretation (Figure 3). When daily minimum atmospheric temperature (Tmin) data are available—either uploaded by the user or retrieved from NASA POWER or Open-Meteo—the tool overlays Tmin on the cold hardiness panel. Shaded regions highlight periods when Tmin falls below predicted LT10 (orange) or LT50 (red) thresholds for freeze-risk interpretation.
Using the Tool
Step 1. Select a Data Source Users may upload local weather data [Required columns: Date (YYYY-MM-DD), J_date, Temp (°F), and Solar (MJ/m²); Optional Temp_min (°F) column enables Tmin overlay and freeze-risk shading] or retrieve data through NASA POWER/Open-Meteo. NASA POWER forecasts are generated for a standard August 15–May 15 seasonal window, with options for either regional presets or custom latitude/longitude entry.
Step 2. Select Forecast Settings
Users may select species-level or cultivar-specific forecasts. Multiple statistical model types are available within the interface, including GLM, RF, NN, SVM, and GBM. Uncertainty bands are displayed around predictions, and interpretation guidance is provided within the application legend.
Step 3. Run Forecast and Download Outputs
After selecting data inputs and forecast settings, click “Run Forecast.” Outputs are displayed across three panels: Cold Hardiness Forecast, Dormancy Progression (LTER), and Relative Water Content (RWC). Forecast tables may be downloaded as CSV files for further review.
Current Forecasted Season

Disclaimer
This tool provides model-based seasonal estimates intended for decision support. Predictions are derived from historical climate–phenotype relationships and may not capture extreme events, microclimate variability, or orchard-specific management effects. NASA POWER data are gridded and represent area-averaged conditions that may differ from orchard-level measurements. Users should interpret outputs alongside field observations and local expertise. The developer assumes no liability for crop damage or management outcomes resulting from use of this tool. Local AgWeatherNet station data or orchard-level sensors are recommended when available.
Contact

Jonathan T. Magby
Yakima Valley College
jmagby@yvcc.edu; jonathanmagby@gmail.com
307-797-5866
Funding and Acknowledgements
Cold hardiness datasets used in in model development were generated under the Washington State Department of Agriculture Specialty Crop Block Grant project “Reducing Cold Damage in Tree Fruit” (PI: Matthew Whiting; Co-PI: Per McCord). Laboratory infrastructure was provided by Matthew Whiting. Plant material was obtained from the Washington State University Roza research orchard (elev. 666 ft; 46.2924°N, 119.7268°W) near Prosser, WA. The author acknowledges members of the doctoral committee: Matthew Whiting, Per McCord, and Cameron Peace.
Additional information
The LTER–Sweet Cherry Model V.1 (Shiny application) is available at:
https://phenostate.shinyapps.io/LTER_Sweet_Cherry_Model_v1/
Comprehensive methodological and physiological foundations for the model are documented in:
Magby, J.T. 2025. Integrating genomic, transcriptomic and physiological insights to untangle cold tolerance, dormancy and flowering time in sweet cherry. Washington State University.
https://doi.org/10.7273/000007414
Fruit Matters articles may only be republished with prior author permission © Washington State University. Reprint articles with permission must include: Originally published by Washington State Tree Fruit Extension Fruit Matters at treefruit.wsu.edu and a link to the original article.
