Written by Dattatray Bhalekar, Juan Munguia de la Cruz, Bernardita Sallato, Lav Khot, Washington State University, March 2026
Over the past two seasons (2024 and 2025), several commercial ground- and aerial-vision systems have been validated at WSU Smart Apple Orchard Testbeds in Mattawa and Zillah, WA. Among these, Green Atlas Cartographer, in collaboration with Innov8.Ag Inc. was evaluated for precision crop-load monitoring. This article describes the technology and summarizes the validation results by the WSU team.
Technology
Green Atlas Cartographer, a commercial sensing platform (Figure 1a) equipped with multiple sensors, including a 2D-LiDAR (Light Detection and Ranging), and high-resolution RGB cameras with strobe lights. The cartographer uses a GPS receiver for geotagging sensed data. The hardware is typically integrated and mounted on the back of an all-terrain vehicle (ATV). The cartographer can be driven at 12.5 mph to collect raw crop-load imagery data covering up to 15 acres/hour. Pertinent data are post-processed using proprietary algorithms to generate variability maps (Figure 2) of estimated crop parameters, including bud count, blossom cluster count, canopy geometry, fruit count, size, and color attributes at tree-level resolution. The system can efficiently scan large orchard areas, with data typically processed overnight and available for decision-making the following day. Output datasets include spatial maps, variability heatmaps, and equipment-ready files (e.g., CSV, GeoJSON, or shapefiles) to support precision orchard management practices such as variable-rate thinning, spraying, pruning, and nutrient applications.

Methodology
In 2024 season, cartographer conducted several scanning campaigns, by Innov8Ag team, at smart orchard (cv. Cosmic crisp TM) testbed, Mattawa, WA. As ground truth, fruit size and count data were collected across four sites, with five trees per zone. The fruit size (diameter) was quantified from five randomly selected apples per tree using a vernier caliper. Ground-truth data were compared with estimates provided by the vision system for the mapping campaigns conducted on May 23 and September 25.

In 2025 season, the validation methodology was improved to ensure a comprehensive assessment by gathering more extensive ground-truth data. Eight data collection sites, with varying blossom densities, were selected within a WSU Smart Apple Orchard Testbed in Zillah, WA (cv. Envi). Five trees per site were monitored for blossom count on April 18, as well as for fruit size and count during key growth stages (on June 5, July 22, August 28, and October 15, 2025). During the final two mapping campaigns, two consecutive scans were performed on the same day to evaluate the repeatability of the cartographer. The average ground-truth data were compared with the average estimates for count and size provided by the cartographer for selected sites, using the Absolute Percentage Error (APE, Bhalekar et al., 2025).

Key Results
- In the 2024 season, for the orchard scans on May 23 and September 25, fruit size (mean ± SD, 38.3 ± 7.4 mm and 81.4 ± 6.7 mm) estimates were comparable to ground truth (33.3 ± 4.88 and 83.1 ± 5.6 mm) measurements. The fruit size estimation APE dropped from 15% early in season to 2% near harvest.
- In the 2025 season, cartographer estimated blossom clusters per tree (231.7 ± 137.8) were 45% higher than the ground truth counts (158.9 ± 124.4). This difference can be attributed to the operator’s reported calibration errors in the cartographer.
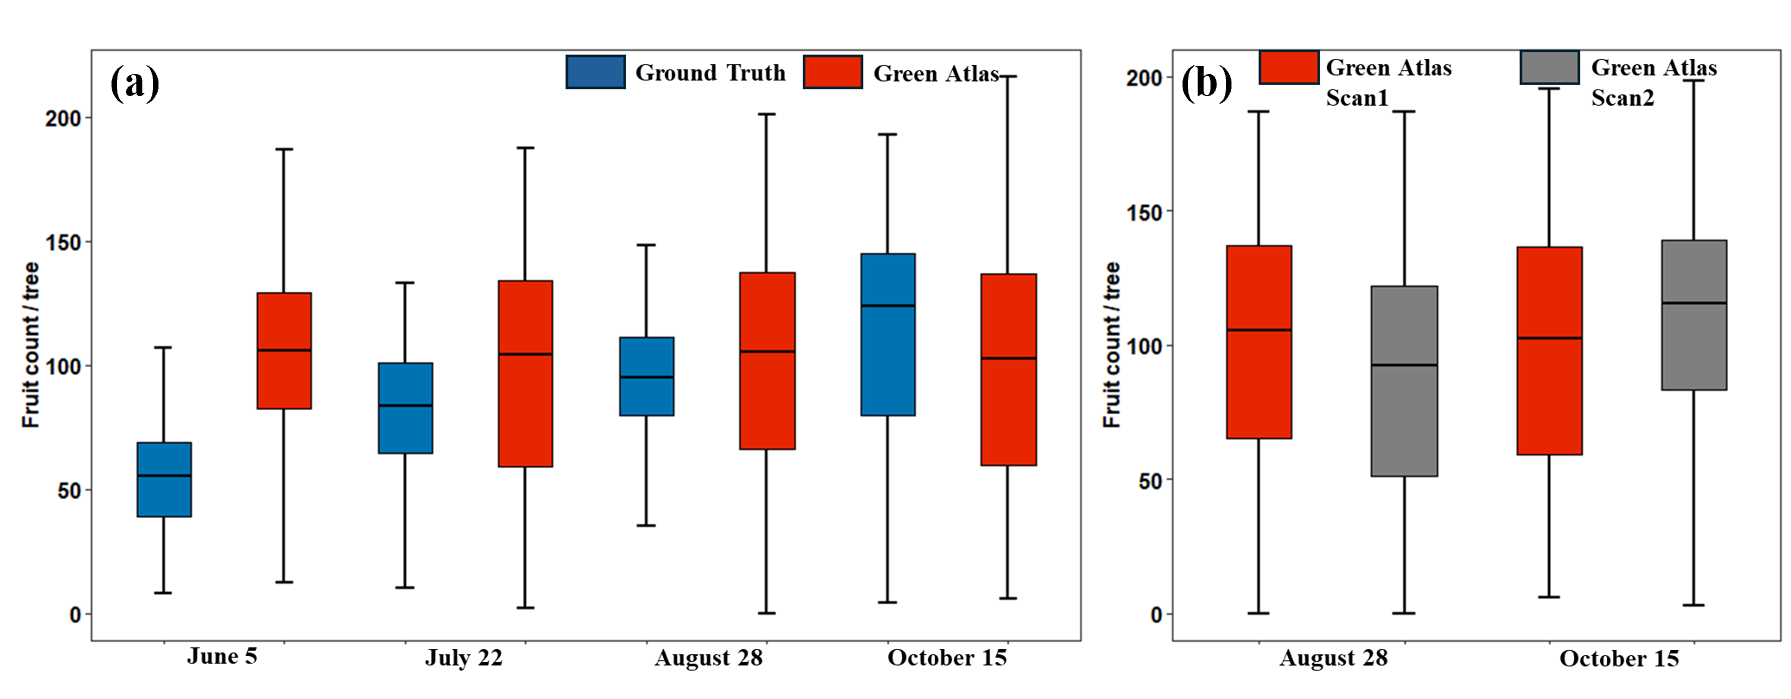
- Cartographer fruit count estimates showed higher differences early in the season but improved as the season progressed. At early fruit set, estimates averaged 100.7 fruit per tree compared to 52.7 from ground truth. Accuracy improved by mid-season (APE 20.4%) and remained relatively consistent during late season and pre-harvest, with APE dropping to 11.8% later in season (Figure 4a).
- Consecutive scans, conducted on August 28 and October 15, demonstrated strong repeatability in fruit-count estimates, with APE in the ranges of 9.4 to13.3% (Figure 4b).
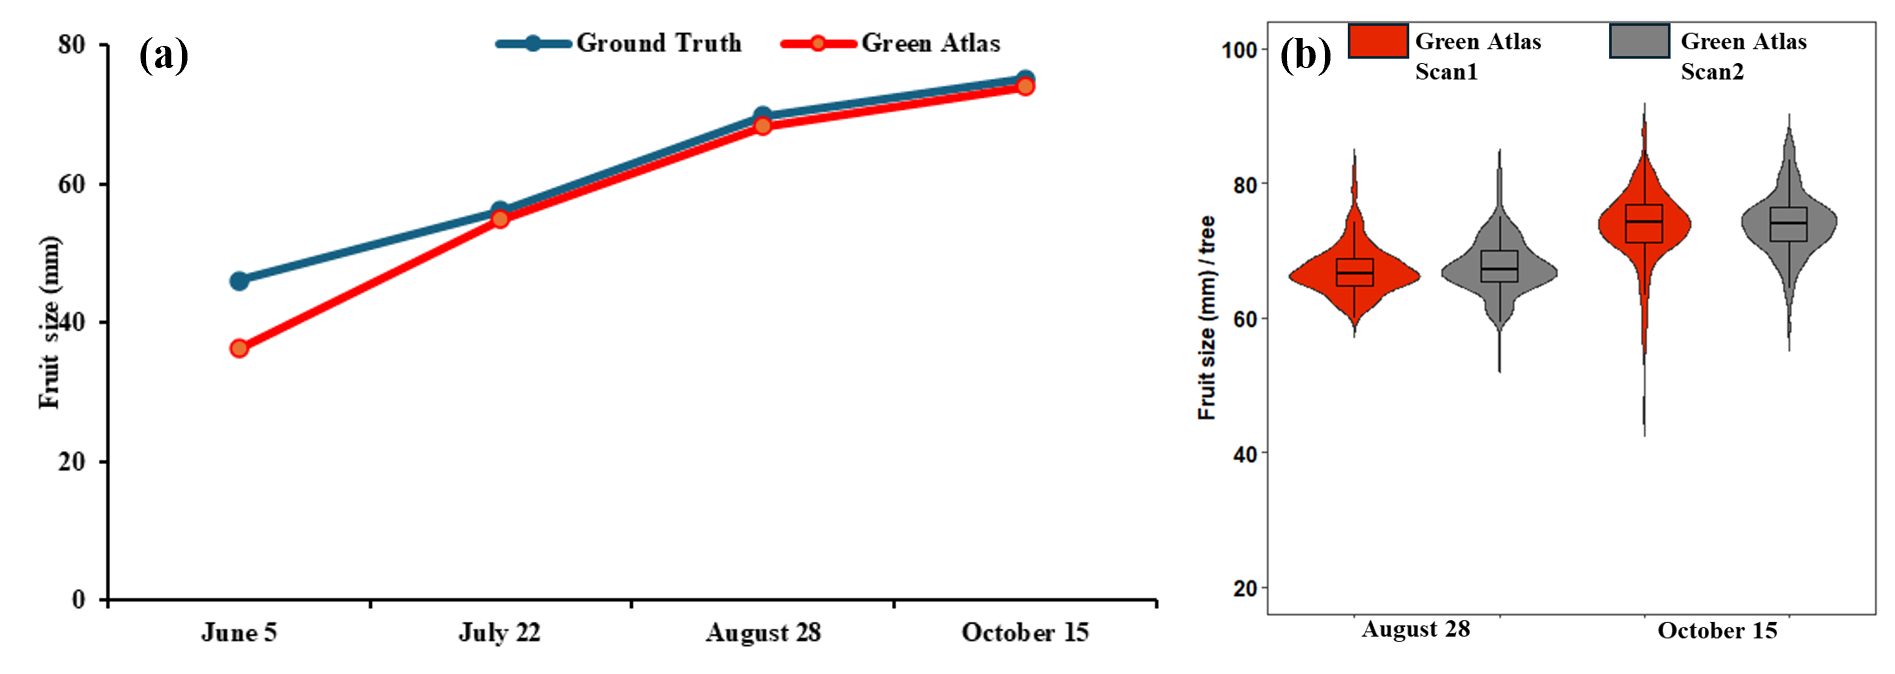
- At early fruit set, cartographer estimated the fruit size was at 36.3 mm compared to 46.1 mm measured as ground truth (APE 21.3%). However, estimation improved significantly by mid-season and remained consistent through late season and close to harvest, with an APE of less than 5% (Figure 5a).
- The repeatability tests showed high consistency in fruit size estimation across consecutive scans, with APE less than 2% (Figure 5b).
Summary
Green Atlas Cartographer enables efficient, high-throughput assessment of crop load across key growth stages, with estimation accuracy improving as the season progresses. Rapid data processing enables growers to access crop-monitoring results quickly, supporting timely, data-driven management decisions throughout the growing season. Vision system calibration on the cartographer plays a key role in reducing errors in crop load estimation. The cartographer indicated strong repeatability in fruit-count and size-estimation data. Importantly, the software platform enables visualization of individual trees as well as the canopy volume and density attributes extracted using fusion of RGB & 2D-LiDAR data.
Contacts

Funding and acknowledgements
These efforts are funded by the Washington Tree Fruit Research Commission (WTFRC). Authors would like to extend sincere appreciation to Innov8.Ag Inc and Green Atlas Inc., for their collaboration at Smart Apple Orchard Testbeds. We would also like to thank grower cooperators, Northwest Farm Management LLC.
Additional Reading
Bhalekar, D., Munguia de la Cruz, J., Sallato, B., Khot, L., Meyer, M., Hanrahan, I., & Schmidt, T. (2025). Digital technology for precision apple crop load monitoring in Washington orchards. https://treefruit.wsu.edu/article/digital-technology-for-precision-apple-crop-load-monitoring-in-washington-orchards/
Disclaimer: The vendors listed in this document are provided for informational purposes only and are not exhaustive. Washington State University Extension and AgWeatherNet does not endorse, recommend, or promote any vendor.
