Written by Dheeraj Vurukuti, Sanjita Bhavirisetty, Lav Khot, Washington State University – AgWeatherNet, May 5, 2026
WSU AgWeatherNet (AWN) has launched bilingual (English, Spanish) grower use focused mobile app that provides easy and free access to over 550 station specific near-real-time (at 5 to 15-min resolution) weather and air quality index (AQI), soil metric potential and temperature data, hind and forecasts, current and forecasts of localized temperature inversion, when-to-spray guidance, and crop specific Evapotranspiration (ET) estimates for irrigation scheduling decision making, and more, on your smartphone. While the AWN website continues to provide full access to current and historical data, crop-specific models, and in-depth analysis tools, the mobile app is designed to complement it by enabling quick, on-the-go data access for management decision-making.
The app is currently available for iOS users on the Apple App Store, with an Android version on the Google Play Store coming soon. Search AgWeatherNet on the Apple App Store or scan the QR code below to download.
iOS Users: App Store
Android Users: Google Play Store – coming soon
App Features
Accessibility: Home Screen Widget and User Preferences
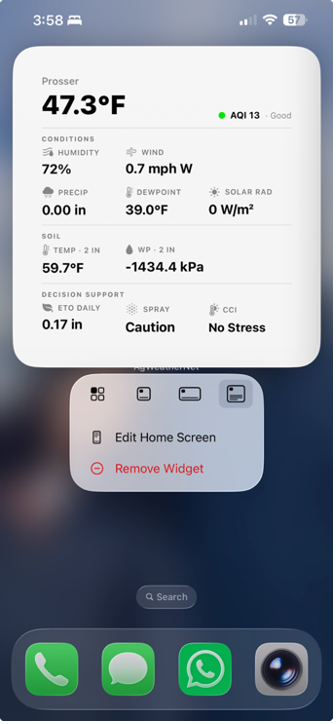
Once installed, the app can also be used as a home screen widget (Figure 1) that displays user preferred station specific current weather, AQI, soil conditions, and key decision support metrics (e.g., when-to-spray guidance, reference ET, and more) directly on the phone’s home screen without opening the app. The widget refreshes automatically in the background, keeping data current whether the app is open or not.
In terms of accessibility, the user can:
- use interactive map view of over 550 stations with satellite, street, and terrain views
- save up to 5 favorite stations for comparing conditions and easily access data by swiping in the home page.
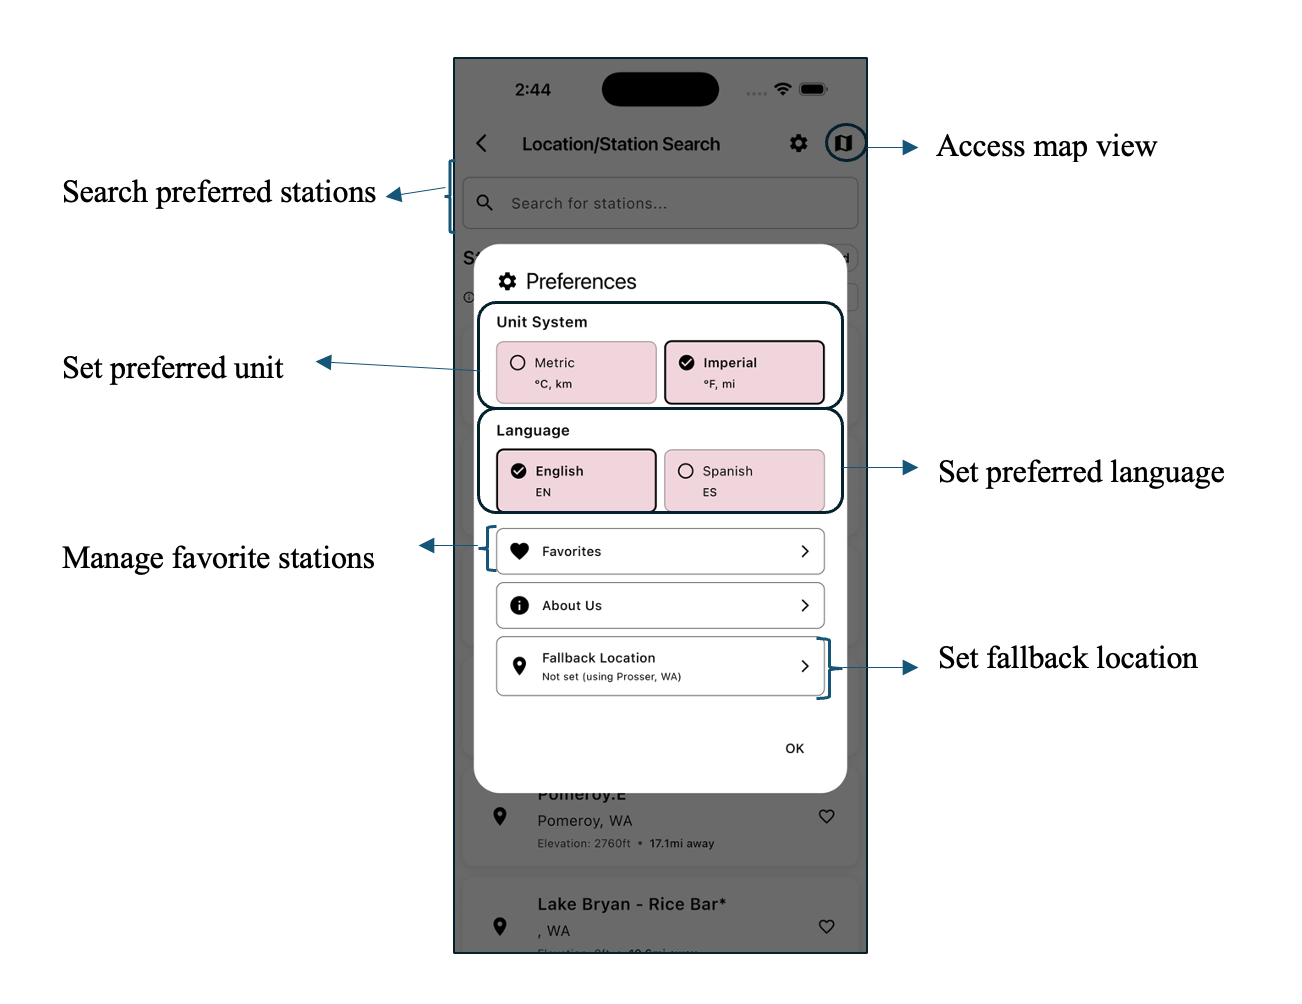
- toggle to select preferred language (English and Spanish), and unit (Metric or Imperial)
- customize dashboard: reorder or hide any of the weather and decision support tool
Weather, Soil and Air Quality Data
The app fetches quality checked weather station specific data, collected at 5-min resolution from AWN’s Mesonet tower station and Legacy Campbell stations, and 15- min resolution data from AWN Legacy Meter stations, Columbia Geoge Fruit Growers Network, as well as AgriMet stations in the Pacific northwest region. The key parameters include:
- Air temperature at 1.5 m (5 ft) and 9 m (30 ft) heights (where available)
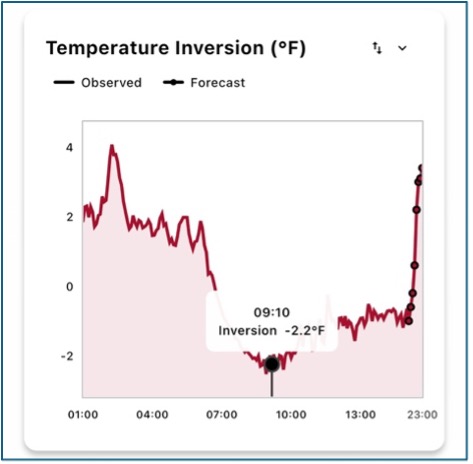
- Temperature inversion (i.e., differential between 5 and 30 ft air temperature) for AWN Mesonet tower stations
- Relative humidity, dew point, and 24-hour precipitation
- Wind speed and direction at 2 m (6 ft) and 10 m (33 ft, where available), including gusts
- Solar radiation
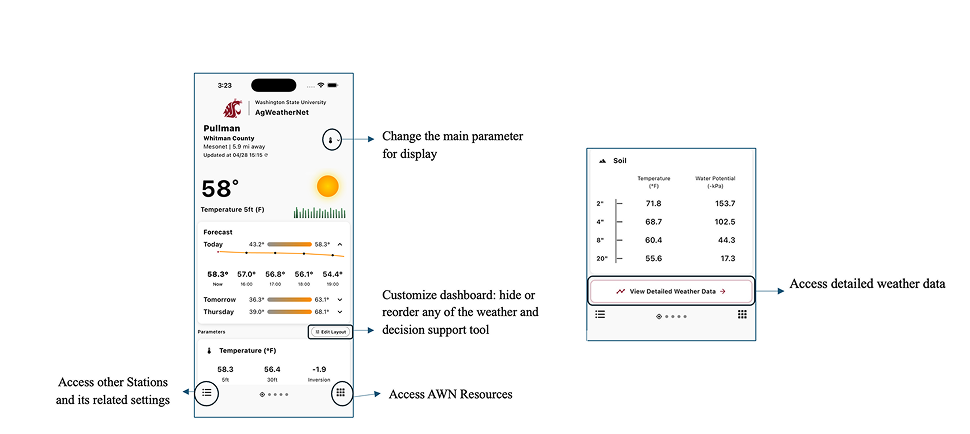
- Soil temperature and soil water potential up to four depths (2″, 4″, 8″, and 20″)
- Air Quality Index (AQI)
Importantly, users can customize (Figure 4) what one would like to see on the home screen.
Observations, Forecasts, and Hindcasts
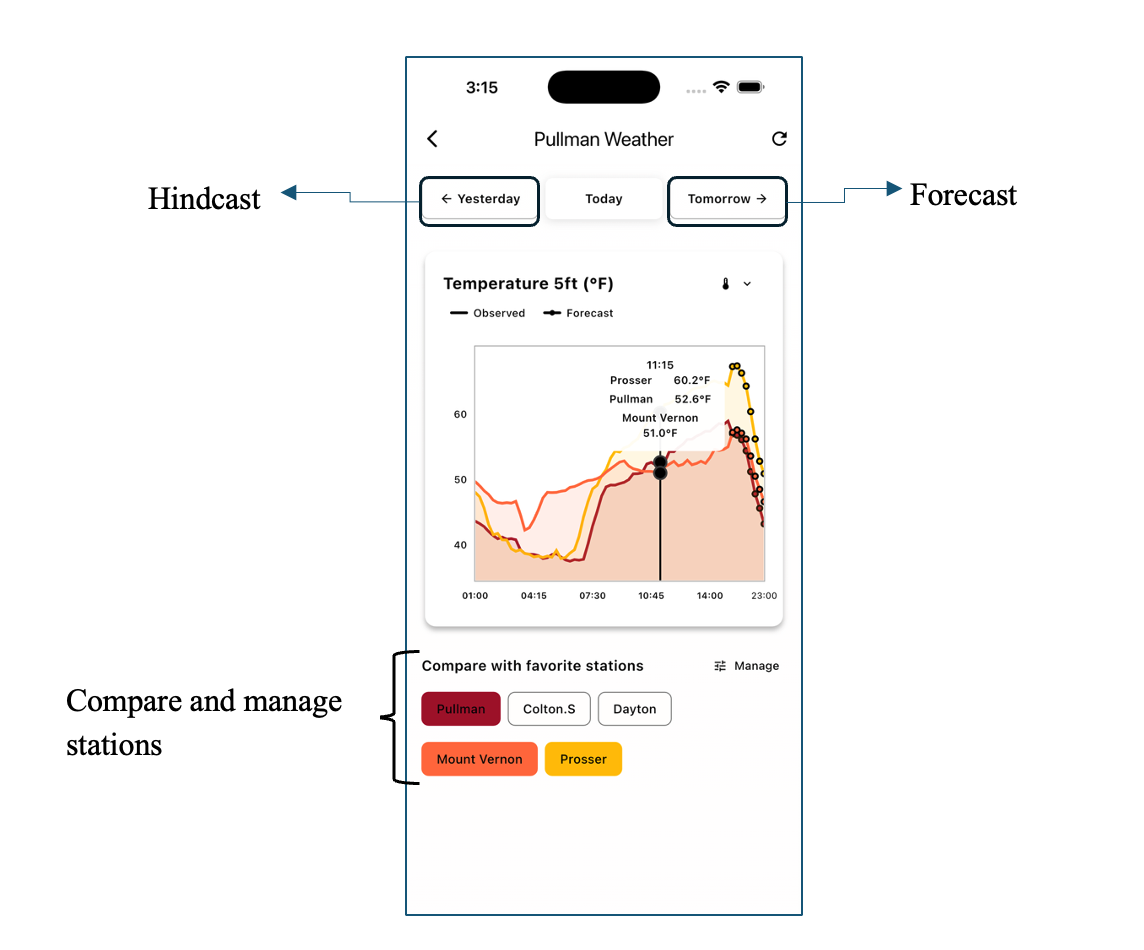
The app provides a quick, consolidated view of key weather windows including current conditions, the past 2 days of observations, and the next 2 days of forecasts all in one place. Current observations show live station data updated to current available timestamp. The forecast provides a two-day outlook for key weather variables, and data derived when-to-spray guidance, crop ET estimates, etc. For historical context, the app also displays observed data going back two days, allowing growers to review how conditions evolved over time and aid in dialing the crop inputs management decisions. All three views are accessible by tapping any weather parameter on the home screen for a detailed look at that specific data, or by scrolling to the bottom of the home screen (Figure 4) to reach the detailed weather data screen (Figure 5), all without needing to switch tools or open a browser.
User can also compare parameters across multiple stations simultaneously on a single screen. By selecting from saved favorite stations (by tapping the heart icon beside any station or using the manage favorites option in the preferences as shown in Figure 2), the app overlays data from each station on the same chart. This tool is useful for comparing multiple neighboring stations before making a management decision.
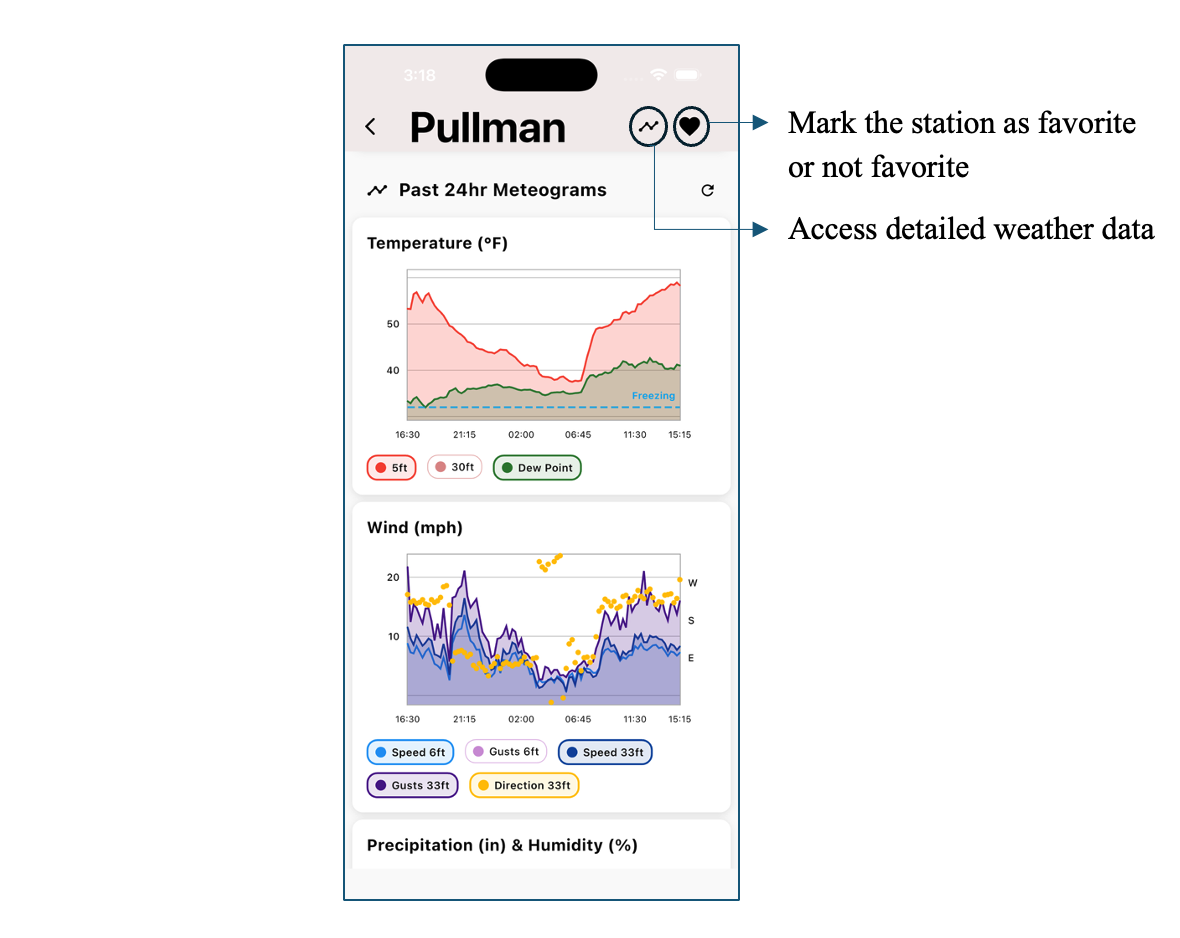
Past 24-Hour Meteograms
From the ‘station-specific’ screen (Figure 6), which can be accessed by selecting a station from the ‘station search’ screen (Figure 2), user can access Past 24-Hour Meteograms that plots observed weather parameters as a continuous time series. This data provides a clear picture of weather pattern change (e.g., temperature, humidity, wind swings.
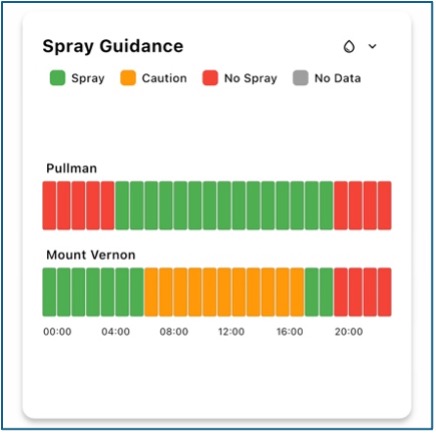
When-to-Spray Guidance
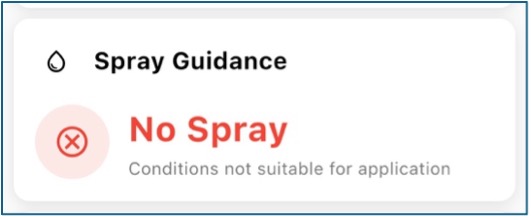
The app includes the AWN Spray Guidance tool (Amogi et al., 2025) within the station view, using real-time observations and forecasts to provide a simple, color-coded advisory, with conditions categorized as Spray, Spray with Caution, or Do Not Spray. For a detailed breakdown of the methodology behind this tool, refer to the March 2025 Fruit Matters article: AgWeatherNet Spray Guide: Tool to Optimize Pesticide Applications in Washington (link opens in a new window).
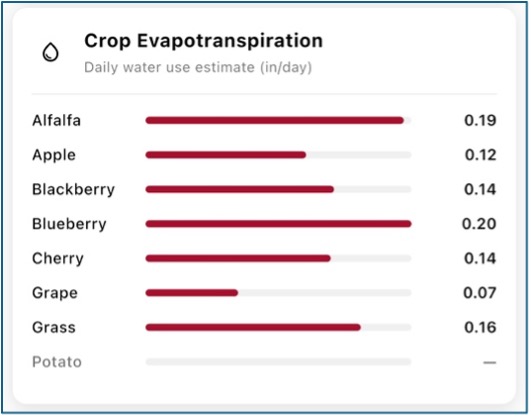
Crop-Specific Evapotranspiration
The app also provides weather station specific reference and crop-specific daily ET estimates for eight major irrigated crops including apples, berries, cherries, and potatoes.
Gateway to the AWN Decision Support Ecosystem
The app serves as a centralized gateway to AWN developed web and mobile app decision support tools. By clicking on bottom right corner (figure 4), you can access a screen that has access to:
- AWN CropAI App: AI-driven mobile app for heat stress management (Thennakoon, N., & Khot, L. (2025, June 4). AWN CropAI: AI-powered sunburn risk assessment and fruit color tracking app. WSU Tree Fruit.)
- AWN CropAI-SWD App: AI-driven mobile app for in-field Spotted Wing Drosophila detection
- AWN Web Portal: Link to our website (opens in a new window)
- AWN Smart Farms platform: Link (opens in a new window) to access your farm/block specific localized soil-plant-weather sensing network driven irrigation, frost/heat stress management
This centralized section will be updated as we develop and add new tools and features. Users who have the app will always have a single, up-to-date entry point to everything AWN offers.
Contact
For feedback on the AWN mobile app or web portal, write us at weather@wsu.edu

Lav Khot
Director, WSU AgWeatherNet
Lav.khot@wsu.edu

Dheeraj Vurukuti
Developer, WSU AgWeatherNet
dheeraj.vurukuti@wsu.edu

Sanjita Bhavirisetty
Application Systems Analyst/Developer
r.bhavirisetty@wsu.edu
Funding and Acknowledgements
WSU AgWeatherNet operational funding was used to develop and release the application. AWN would like to thank AgWeatherNet team members for their time testing the application and providing valuable feedback throughout the development process.
Fruit Matters articles may only be republished with prior author permission © Washington State University. Reprint articles with permission must include: Originally published by Washington State Tree Fruit Extension Fruit Matters at treefruit.wsu.edu and a link to the original article.
