Written by Allyson Leonhard1, Kelsey Galimba2, Gwen Hoheisel1, Clark Kogan1, Ashley Thompson2 1Washington State University, 2Oregon State University. February 6, 2025.
Introduction
Predicting hardiness levels of perennial fruit plants is essential for frost management. Because sweet cherry (Prunus avium) is among the earliest to initiate development in the spring, it is particularly susceptible to late frost events. Currently, the lethal temperatures (LT) of a given orchard are estimated based on phenology charts that correlate developmental stage with LT, requiring the grower to accurately characterize the bud stage most prevalent in their orchard. One challenge is that in early bud stages, a remarkable amount of internal development (and hence LT changes) occurs without a visible change to the outside of the bud. Additionally, local weather impacts hardiness. To address this, a cold hardiness model was created to help estimate LT. The beta version is currently posted on AgWeatherNet and we encourage your feedback.
Sweet Cherry Floral Development
Floral development of sweet cherry occurs the year before. When sweet cherries are maturing, the next years buds are forming. Floral initiation begins in mid-summer where the bud begins forming cup like structures and lobes where sepals will form. By fall, the bud has all the floral organs present but in an immature or undeveloped stage. At this point development pauses through dormancy. In late winter to spring, the buds go through rapid stages of development until they are reproductively mature in April.
Physiology of Cold Acclimation:
Overwintering cherry buds have floral primordia which is tissue inside the bud that form into flowers (Fig. 1).
Cherries acclimate to cold temperatures by supercooling. This is achieved when the bud encourages ice to form in regions surrounding the outer floral primordia but liquid inside of the floral initial is able to drop down below freezing temperatures without transitioning from a liquid to a solid. Between the ice and the floral primordia there are tissues that act as a physical barrier allowing the supercool liquid to not freeze into ice crystals which would damage the bud. Because the buds are separated from the main tissues of the plant, they are isolated from the water that can develop ice. Once development restarts in February, the vascular connection is reformed, and supercooling is lost.

Dormancy Phases throughout the season
Cold hardiness of sweet cherry buds changes from fall to spring. Fall acclimation begins with decreasing temperatures and shorter days which trigger physiological changes that increase cold hardiness (Fig. 2). In this period of endodormancy, the trees are regulated by plant hormones to keep the tree dormant until chill units have been acquired. Once a tree has reached it’s chill requirement, it transitions into ecodormancy where cold hardiness is more regulated by environmental factors. Buds can begin to deacclimate to cold temperatures and progress in development. This is the most critical time for bud damage.

Figure 2: Dormancy phases with acclimation in the fall and deacclimation in the spring. Lethal temperature at which 50% of the buds will die (LT50) decreases as the buds become more cold hardy (yellow). Vernalization is the point at which all chill units have been accumulated. Pictorial design adapted from Greg Lang, MSU.
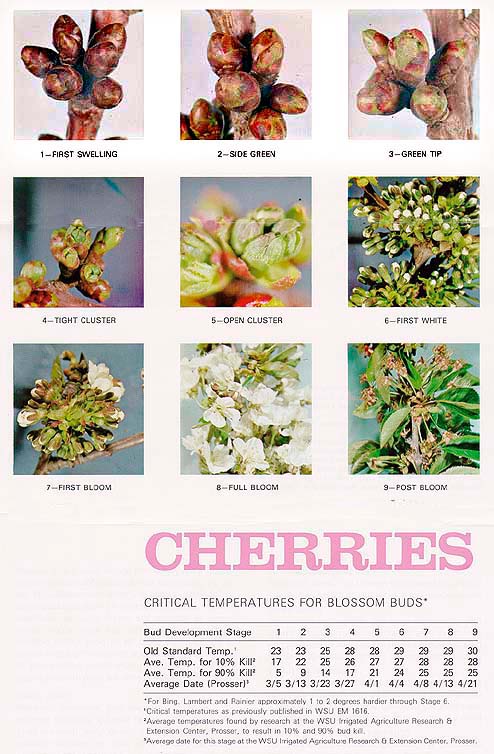
Lethal Temperature Charts
Lethal temperatures of cherry buds are currently estimated using charts that predict LT with phenology of bud. However, phenology is not the most significant or accurate predictor of bud lethal temperature, especially in the early stages of dormancy like in bud swell where internal development can occur without external appearances changing. Between dormant to first swell (stage 0 to 1), there is significant bud development internally where cold hardiness is lost, yet the external phenology appears unchanged. Some orchardists have noted this and look for yellow pollen development by cutting open dormant buds. Any yellow pollen development typically means some loss of lethal temperatures compared to the traditional Critical Temperature Chart.
BETA Model
To account for local conditions and better predictions of hardiness or potential loss, a model was constructed in collaboration with OSU and WSU. In 2021 and 2022, buds from four cultivars (Bing, Sweetheart, Chelan, and Regina) and three regions (Hood River, OR, The Dalles, OR, and Prosser, WA) were collect, frozen and assesses for damage. The Columbia Gorge Fruit Growers has funded Drs. Ashley Thompson and Kelsey Galimba to collect additional data in Oregon for this winter. That data will be used for a validation of the model and help inform the industry if more research is needed. If you have comments or concerns contact Kelsey Galimba kelsey.galimba@oregonstate.edu or Gwen Hoheisel ghoheisel@wsu.edu
The model posted on AgWeatherNet (AWN) is in beta format. While, we have confidence in the results, there is limited data for some cultivars and only 2 years of data. Therefore, the model is going to be assessed again with a small single-site project funded in Oregon. This data will be used for validation of the model building more confidence.
How to Use the Cherry Cold Hardiness Model
After logging in to AWN, the left navigation menu will lead to “Models” and then “cherry”. There are three important factors to access your total risk from a cold event.
- Average lethal temperature
- Range of damage that can occur
- Assessing your field to see variations from the predictions for the average and from the predicted lethal temperature
The (1) average lethal temperature (LT) can be seen in the graphs (Fig 3) with LT10, LT25, and LT 50 or the temperatures in which 10%, 25%, and 50% of the buds are expected to die. LT10, ± 2.8oF, predicts the temperature for which the majority of all fields will experience 10% damage or less, but some fields may experience a great deal more. Or in converse, some fields will experience much less damage and were cold hardy more than the LT reported. The LT10 reported is conservative to account for most fields being protected. There is high variability between fields from location, vigor, and other planting factors, therefore a (2) range of damage can occur. For example, Bing with LT10 showed damage in fields ranging from 1 to 46%. It is very important to start (3) assessing fields to determine variations from the prediction. This is analogous to our current interpretation of temperature data from AWN weather station. With time, growers know if an orchard is generally warmer or cooler than the local AWN temperature. Likewise, diligent assessment of a field damage in cold events will inform if an orchard is typically hardier than the reported LT or less. If you suspect damage in the field or notice the temperature line approaching the LT lines in the chart, field damage should be assessed to understand if the block is less or more cold hardy then the average LT10. Collect 50 spurs from a single block and cultivar. Slice the spurs below the equator of the bud to count the number of flowers that are dead or alive inside. If the prediction on the model is predicting 10% mortality but the assessed damage is greater, then in block less cold hardy than the average. But it will be much more common to observe less than 10% damage, meaning the block is more cold hardy than the reported LT.

References
Houghton, E., Watanabe, Y., Neilsen, D., Nelson, L.M. and Hannam, K., 2024. Investigating properties of sweet cherry (Prunus avium) flower buds that help promote freezing avoidance by supercooling. Plant Biology, 26(6), pp.1067-1078.
Funding
This work was funded by the Oregon Sweet Cherry Commission and the Washington Tree Fruit Research Commission.
Fruit Matters articles may only be republished with prior author permission © Washington State University. Reprint articles with permission must include: Originally published by Washington State Tree Fruit Extension Fruit Matters at treefruit.wsu.edu and a link to the original article.
