Written by Dattatray Bhalekar, Juan Munguia de la Cruz, Bernardita Sallato, Lav Khot, Washington State University, September 2026
Autonomous orchard monitoring technologies are increasingly becoming part of block-level precision inputs and labor management, with on-demand information-gathering capabilities. Over the past two seasons (2024 and 2025), several commercial ground- and aerial-vision systems have been validated at WSU Smart Apple Orchard Testbeds in Mattawa and Zillah, WA. Among these, the aerial crop mapping workflow developed by Outfield Technology (UK) and Tyton Aviation (WA) was also tested. In 2025, a Drone-In-A-Box (DIAB) was installed at the Smart Apple Orchard Testbed in Zillah, WA. The DIAB operates remotely on demand, providing a fully automated workflow for capturing high-resolution crop aerial images and subsequent processing of variability maps, such as bloom density, crop load, canopy vigor, and ground cover, throughout the season. This article details the technology, the data processing pipeline, and a summary of WSU trials validating this technology in commercial Washington orchards.
Drone-In-A-Box Imaging System
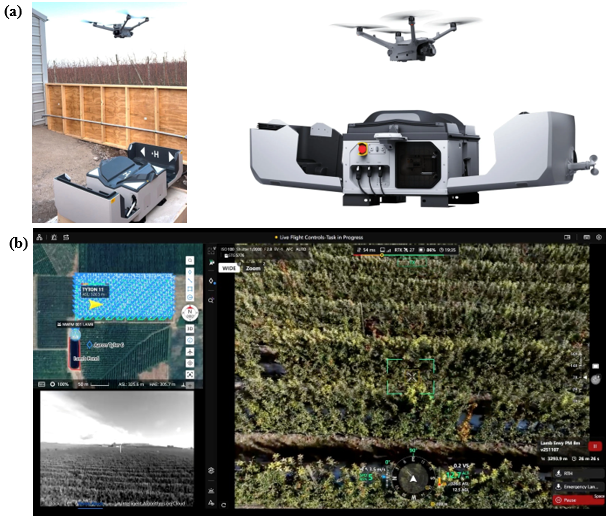
The DIAB installed at the testbed (Figure 1a) consists of a DJI Dock 2 (DJI Technology Co., Ltd., China), powered by solar, paired with a drone (model: Matrice 3D). The drone was configured to operate independently and on demand. The DIAB system connectivity was realized through a cellular network. In remote areas with sparse connectivity, Outfield Technologies and Tyton Aviation have also used satellite-based connectivity (e.g., Starlink) for remote operations and have found it reliable. The deployed drone was equipped with an integrated, gimbaled RGB camera that captures images at around 400 pixels per 3-inch apple. This unit also has multispectral imaging capabilities, with four dedicated sensors covering Green, Red, Red-Edge, and Near-Infrared bands. All imagery is geospatially referenced with Real-Time Kinematic (RTK) positioning, multiple GPS receivers, and an available base station. During the 2024 and 2025 flight campaigns, the drone was flown with a 45° camera orientation, providing a complete trunk-to-top side view of the tree. The DIAB allows the user to remotely upload the flight mission and track the mapping progress on a computer (Figure 1b). Outfield Technologies has developed a data-processing pipeline using proprietary machine vision algorithms to create orchard-specific variability map(s). The vendor claims to have an algorithm that can detect fruits even in fields with overhead netting.
For most applications, the experimented workflow generates maps of average estimated crop parameters, displayed in a 16.5×16.5 ft grid, based on sampling from 60% of the tree. However, this technique can also generate on-demand tree-level data with 100% tree coverage for precision blossom or fruit-thinning applications.
Data Flow and Analytics Pipeline
As deployed, DIAB can survey up to 250 acres per day within a 2-mile radius without human pilot involvement. The 8.1-acre orchard testbed site in Zillah was typically flown and completed within about 15 minutes from launch to landing.
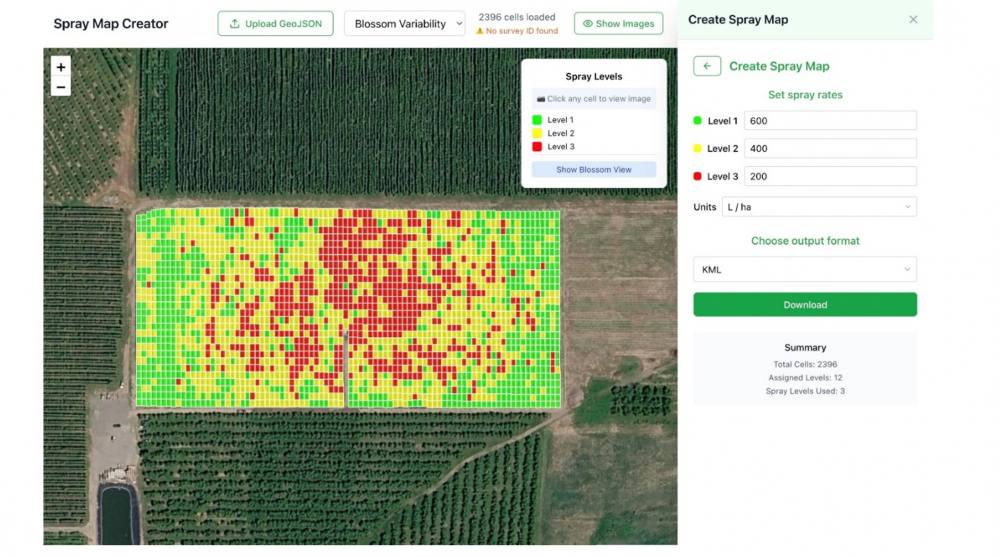
At the end of each flight mission, the drone automatically transfers its imagery to the cloud and begins recharging. Outfield Technologies has developed a data processing workflow that generates block-specific variability maps. In WSU trials, blossom maps and early-season fruit load maps were developed, with fruit size starting at around 25 mm in diameter and absolute fruit counts/tree. The latter were developed by calibrating the scanned data against hand counts. Canopy maps quantify percent canopy fill, which serves as a useful indicator of sunlight interception, while fruit size variability maps highlight differences in growth across orchard panels of approximately 30 ft each, allowing growers to inspect the underlying imagery directly alongside numerical data. Typically, the Ortho-mosaiced block-level data is also used to generate NDVI (Normalized Difference Vegetation Index), SAVI (Soil Adjusted Vegetation Index), NDWI (Normalized Difference Water Index), NDRE (Normalized Difference Red Edge), and CHI (Chlorophyll Index) indices, which can help growers understand vigor variability and water stress within the block. Outfield’s data analytics platform supports integration with soil maps, terrain models, and historical block data, helping growers understand the drivers of variability. These maps can be converted into precision management maps (e.g., blossom thinning, nitrogen, etc.) (Figure 2) for ingestion by equipment like sprayers and spreaders or to guide farm crews. The information is accessible on desktops and mobile devices to assist with in-field verification.
Technology evaluation at Smart Orchard Testbed
To evaluate the accuracy of the aerial vision system, the WSU team compared fruit counts estimated from drone mapping with manual fruit counts collected in the orchard.
In the 2024 season, the Outfield and Tyton team manually conducted scanning campaigns with a drone pilot in the field at the WSU Smart Apple Orchard (cv. Cosmic CrispTM) site in Mattawa, WA.
In 2025, a DAIB setup was installed at the WSU Smart Apple Orchard (cv. Envy) site in Zillah, WA. At this site, blossom counts were mapped through autonomous drone flights on April 18, followed by fruit counts monitored on June 5, July 22, August 28, and October 15. Two consecutive scans were also performed on the final two mapping days to assess repeatability.
To capture the variability in crop load per tree across the block, ground-truth fruit count data were collected from five trees across four randomly selected sites in 2024 and eight sites in 2025. The results below compare vision system estimates with hand counts for the data collected at multiple fruit maturity stages, i.e., on July 18, August 26, and September 25 in season 2024.
Results
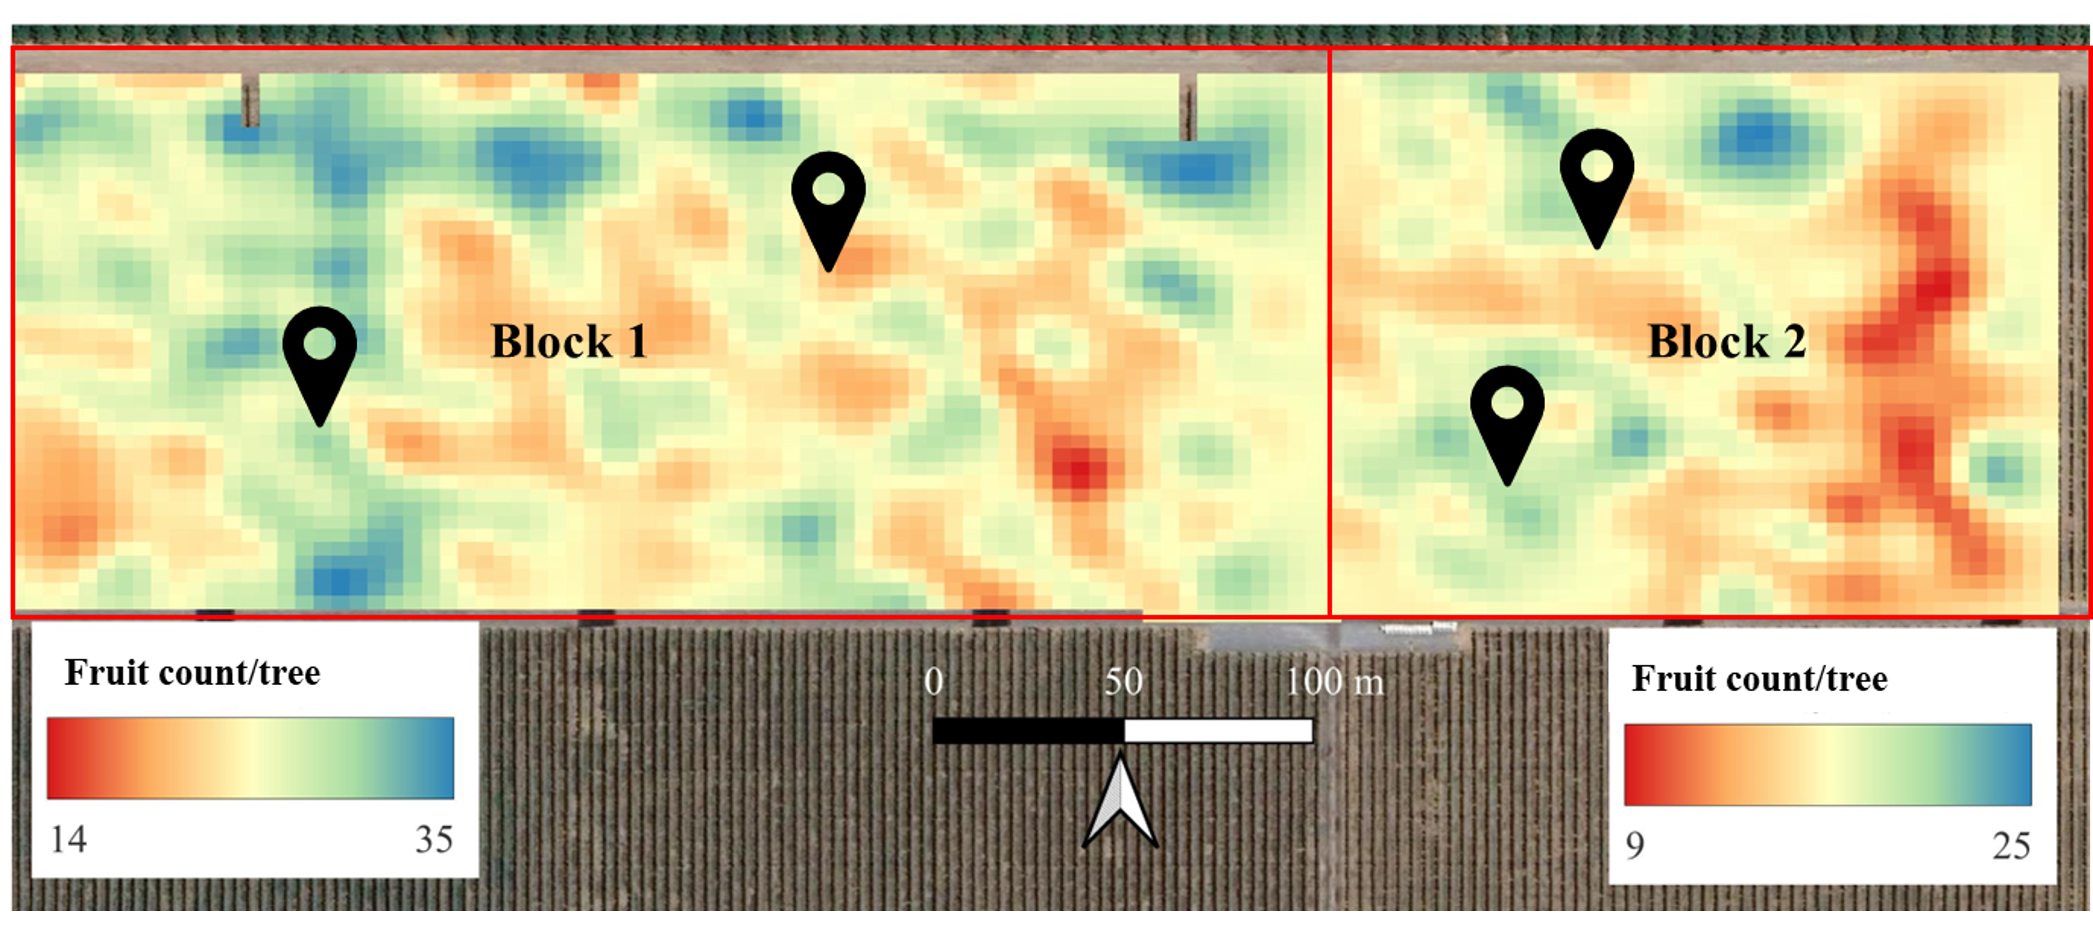
During the 2024 season, on July 18, the vision system estimated 16 ± 5 fruits per tree, compared to 19 ± 11 for the ground truth. On August 26 and September 25, the estimates were 20 ± 6 and 22 ± 5 fruits per tree, respectively, which align with ground-truth values of 21 ± 11 and 19 ± 11 fruits per tree. Overall, the data showed a relative difference of 5-15% between the vision system estimates and the hand counts.
Next steps
In the 2026 and 2027 seasons, Outfield is expanding its capabilities to include thermal imaging with the Matrice 4T drone model and the Dock 3 platform, enabling monitoring of canopy stress and temperature variations.
Additionally, the WSU team has focused on integrating spray task maps generated by the Outfield DIAB aerial scans into variable-rate nutrient application (team: Bernardita Sallato, Lav Khot, and Dattatray Bhalekar) and precision sprayers for blossom thinning (led by Steve Mantle from Innov8Ag in collaboration with Gwen-Alyn Hoheisel and Lav Khot). These trials have used conventional sprayers/spreaders retrofitted with a RedAnt spray control system (Reid & Verwey Ltd., South Africa).
Contacts

Dattatray Bhalekar
WSU Tree Fruit Extension Educator (Horticulture Technology)
dattatray.bhalekar@wsu.edu
(509) 778-8646

Bernardita Sallato
Associate Professor
WSU Tree Fruit Extension
b.sallato@wsu.edu
(509) 439-8542
Lav Khot
Professor of Precision Agriculture
WSU AgWeatherNet and CPAAS
lav.khot@wsu.edu
(509) 786-9302
Funding and acknowledgments
These efforts are funded by the Washington Tree Fruit Research Commission (WTFRC). The authors extend their sincere appreciation to Outfield Technology, Tyton Aviation, and the RedAnt team for their collaborations at the Smart Apple Orchard Testbeds. We also thank grower cooperators Northwest Farm Management LLC and Columbia Farm Service LLC.
Additional Reading
- Bhalekar, D. G., Munguia de la Cruz, J., Sallato, B., & Khot, L. R. (2026, March). Vivid XV3 vision system for precision crop load monitoring. Washington State University. https://treefruit.wsu.edu/article/vivid-xv3-vision-system-for-precision-crop-load-monitoring/
- Bhalekar, D. G., Munguia de la Cruz, J., Sallato, B., & Khot, L. R. (2026, March). Green Atlas cartographer for precision crop load monitoring. Washington State University. https://treefruit.wsu.edu/article/green-atlas-cartographer-for-precision-crop-load-monitoring/
Disclaimer: The vendors listed in this document are provided for informational purposes only and are not exhaustive. Washington State University Extension and AgWeatherNet does not endorse, recommend, or promote any vendor.
Fruit Matters articles may only be republished with prior author permission © Washington State University. Reprint articles with permission must include: Originally published by Washington State Tree Fruit Extension Fruit Matters at treefruit.wsu.edu and a link to the original article.