Written by Raesibe Kgaphola, Melissa Garcia, Michael Meyers, David Gonzalez, and Manoella Mendoza, WA Tree Fruit Research Commission, August 06, 2025
Fresco is a new sensor developed by Vertigo Tech, a startup spin-off of Delft University of Technology in the Netherlands, and part of the Orchard of the Future Dutch-USA collaboration. The sensor is a hand-held device that uses low-energy microwaves to non-destructively measure fresh fruit quality parameters such as Brix, titratable acidity, firmness, juiciness, dry matter, and browning. One differential is that microwaves penetrate deeper into the fruit flesh in comparison with, for instance, NIR sensing. The sensor is in the pilot stage, with prototypes tested by Vertigo Technologies and Wageningen University in the Netherlands (part of the Next Fruit 4.0 Cool data) and the WTFRC.
In 2023, one bin each of Gala, Honeycrisp, and WA 38 apples were harvested at commercial maturity and treated with postharvest fungicide before storage. The WA 38 and Gala were stored in a Stemilt RCA room (RA, 33°F), while Honeycrisp was conditioned and stored in the WTFRC cold room at 37°F. The fruit was not treated with 1-MCP. A total of 700 apples per variety were sampled during four sessions, from January to April. The apples were taken out of storage the day before quality assessment, numbered, placed in trays, and left at room temperature for one day. Each apple was processed individually.
The data from the three cultivars were combined to perform the model training and validation for each quality parameter. The training is conducted using 90% of the dataset and cross-validated using the remaining 10% unseen by the model. The model training and validation scatterplots (Figure 1) and the correlation coefficient and error (Table 1) show variability in prediction accuracy between quality parameters. Positive correlations for soluble solids, firmness, and titratable acidity are weak, moderate, and strong, respectively, when predicting quality parameters for a randomly selected set of apples unseen by the model.
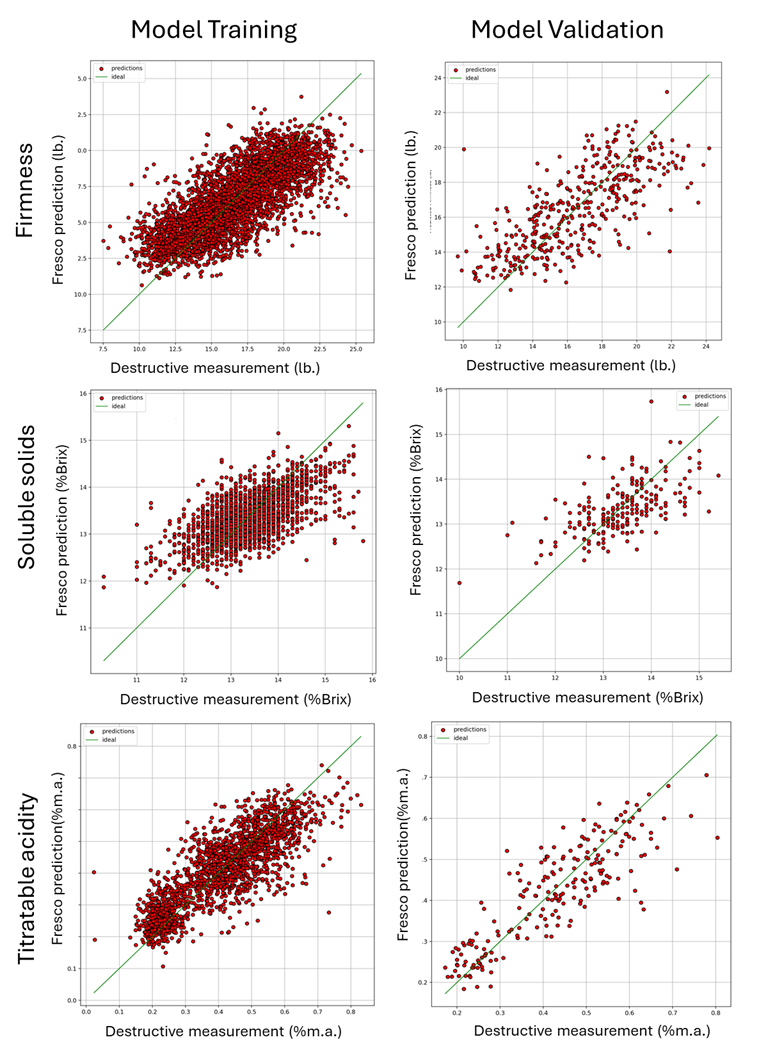
Among the three tested quality parameters, the best-fitting model was for titratable acidity, with a prediction power of about 70%. The r2 is higher, and the error is lower for the validation set than the model training set, indicating that predictions were more accurate for the independent set of values. The mean absolute percentage error (MAPE) decreased by 3.8% for the validation set. Firmness predictions for the validation set were equivalent to those for the training set, with a r2 of 0.5 and an MAPE of 10%.
Soluble solids have the lowest correlation and error. The low correlation coefficient (r2 = 0.405 and 0.331) can be associated with the range restriction of Brix values, as the lower absolute error indicates that the predicted values are close to the measured values. Thus, increasing the range of values for soluble solids might generate a higher correlation coefficient. The prediction of soluble solids was assessed using the Felix F-750 instrument based on a generic apple model (data not shown). The correlation coefficient for the Felix prediction was lower (r² = 0.194) than the Fresco prediction (r² = 0.331). It’s important to emphasize that high correlation coefficients (above 0.7) can be achieved with the Felix instrument when developing a variety-specific model or conducting a Partial Least Squares (PLS) analysis using the data generated by Felix. However, this experiment evaluated the instrument’s ability to deliver quality parameter results promptly without requiring further data manipulation by the user. Additional data analysis will be conducted throughout this project to compare the predictive power of both instruments.
Table 1. Coefficient of determination (r2), root mean square error (RMSE), maximum absolute error (MAE), and maximum absolute percent error (MAPE) for the sample sets used by Fresco in the model training and validation to predict soluble solids, firmness, and titratable acidity values.
| Parameter | Sample Set | r2 | RMSE | MAE | MAPE |
|---|---|---|---|---|---|
| soluble solids (%Brix) | Model | 0.403 | 0.599 | 0.461 | 3.5% |
| Validation | 0.331 | 0.658 | 0.511 | 3.8% | |
| Firmness (lb.) | Model | 0.555 | 2.095 | 1.649 | 10.0% |
| Validation | 0.518 | 2.096 | 1.657 | 10.0% | |
| Titratable acidity (% malic acid) | Model | 0.677 | 0.080 | 0.062 | 17.7% |
| Validation | 0.723 | 0.074 | 0.056 | 13.9% |
Conclusion
The wavelengths associated with firmness, soluble solids, and titratable acidity were identified in the microwave spectra region. A positive correlation was achieved for the three quality parameters with a varying prediction power range. The strongest correlation was found for titratable acidity, followed by firmness and soluble solids concentration. The narrow distribution range affected the prediction of soluble solids, but the MAPE is low, indicating a low error between the prediction and the observed value. Overall, the results are promising, but more data is needed to evaluate the instrument’s accuracy.
Coming next
During the 2024 season, Honeycrisp, Granny Smith, Gala, and two WA 38 blocks were sampled and analyzed at harvest and during storage. The collected data is currently being analyzed and will contribute to the development of an apple model that will be tested in the 2025 season. Additionally, to evaluate if the sensor can be used to determine harvest timing, pre-harvest data were gathered in 2024 and will be collected again in 2025.
Contact
Manoella Mendoza
Tree Fruit Research Commission
manoella@treefruitresearch.com
Fruit Matters articles may only be republished with prior author permission © Washington State University. Reprint articles with permission must include: Originally published by Washington State Tree Fruit Extension Fruit Matters at treefruit.wsu.edu and a link to the original article.
