Written by Marcella Magby and Per McCord, Washington State University, May 2025
Fruit analysis evaluation in the WSU cherry breeding program is manual and visually based, which can lead to possible errors and bias. The breeding program evaluates a wide range of fruit quality traits during both harvest and postharvest laboratory assessments. During harvest evaluations, traits including fruit weight, diameter, color, defects such as field cracking, field pitting, doubles, and blemishes are recorded. Additional measurements encompass firmness, titratable acidity, soluble solids content (Brix), and stem pull force. Postharvest laboratory assessments include fruit weight, diameter, color, luster, evaluations for mold, pitting, and stem browning. Firmness, titratable acidity, and soluble solids content (Brix) are also measured to assess postharvest quality. In 2023, the Washington State University – Irrigated Agriculture Research and Extension Center (WSU-IAREC) acquired a single lane optical sorter with InVision2 software and cameras designed for cherries developed by TOMRA Food (Figure 1). The WSU breeding program primarily uses the sorter for research purposes, so it is a small-scale version of what is commercially used. The sorter classifies the cherries based on various traits such as diameter, size, color and defects. Equipped with both visual and infrared cameras, it allows for high resolution surface evaluation, providing for a more precise assessment of each cherry.

The program started using the sorter in the summer of 2023, initially using maps for red cherries and a “Rainier” variety cherry map that were provided by a trainer from TOMRA. A sorting map refers to a data-driven tool to help the sorter software to make efficient and accurate decisions about how to handle the cherries based on specific quality parameters, which are set by the operator (Figure 2).

A map tailored to the needs of the breeding program was developed with a focus on traits measured in the fruit lab, but at a larger scale. The first map was developed in the summer of 2023 and was focused on traits evaluated at harvest, such as fruit size, external defects (field pitting, field cracking, blemishes), and decay. A specific map for color detection following the color index chart developed by WSU extension, the Washington Tree Fruit Research Commission and the Oregon Sweet Cherry Commission, which is similar to the CTIFL color scale (Figure 3) was developed in 2024 but is being refined. In addition, a map focused on postharvest traits was developed for pitting and decay.

Photos are a critical component for the functionality of the machine. The machine takes photos from angles using mirrors and color and infrared cameras inside the sorter. The infrared cameras are effective in visualizing defects. The sorter captures several images per individual fruit and the software classifies the fruit into grades pre-established by the operator. The grades can be customized to the needs of the user (Figure 4). The images show blobs on the surface of the fruit, which correspond to surface defects (Figure 4). Each color in the image represents a different type of defect being detected. If the machine misidentifies a defect, the operator can manually adjust the classification of a defect to ensure accuracy.

The cherry breeding program currently uses 50 fruit as the standard sample size in the laboratory, which can be very misleading when you think about a large tree with a lot of fruit. The optical sorter allows for a more efficient and consistent data collection of fruit size, color, surface defects, and decay, which reduces subjectivism due to possible human error. The sorter can analyze fruit at the rate of about 15 fruit per second, which means we can quickly analyze every piece of fruit from our research plots. The equipment is currently used for phase 2 and phase 3 evaluations, and we plan to expand it to phase 1 (seedlings) in 2025.
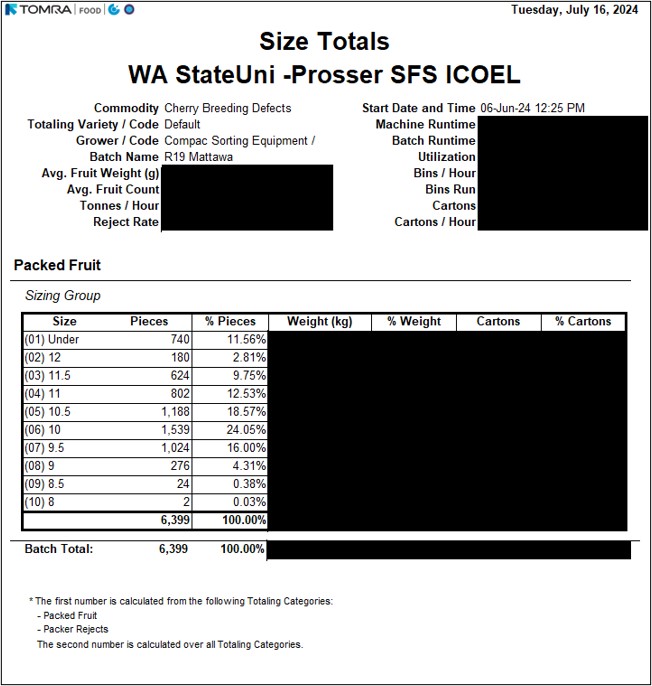
The optical sorter also generates many different reports at the end of each run, which are comparable to those produced by commercial fruit packing companies. One of the reports produced is the size distribution for each set of fruit, where it shows the total amount and percentage of fruit for each row size detected (Figure 5).
The optical sorter is an efficient method of evaluating fruit after harvest and postharvest. The data extracted from the optical sorter can be very helpful for making breeding decisions, which will play a role in a future cultivar release from the program. Another advantage of using the sorter is that it requires only two people to operate the equipment, whereas the laboratory assessment demands at least 4 people at a time.
For the 2025 summer season, the plan is to run all samples through the sorter, including phase 1 in addition to phase 2 and phase 3 samples. One key focus will be maintaining consistent cold chain for the fruit throughout the process to improve data collection. All future assessments of defect detection, size and diameter will be exclusively assessed by the sorter, eliminating any subjectivity associated with laboratory evaluations to ensure consistency. Another goal is to evaluate color using the improved color map for more accuracy. We also hope to be able to use the sorter to evaluate postharvest stem quality.
Contact

Marcella Magby
WSU-IAREC
Stone Fruit Breeding & Genetics
509-786-9306
m.galenisoaresrafae@wsu.edu

Per McCord
Washington State University
509-786-9254
phmccord@wsu.edu
Funding and acknowledgements
This research was funded by the WSU Tree Fruit Endowment Fund, AgWest Farm Credit, the Washington Tree Fruit Research Commission, the Oregon Sweet Cherry Commission, CAHNRS, and IAREC. We sincerely thank Annie Wall and all of our summer workers for their contribution to the breeding program.
Additional information
New optical sorter has cherry research lining up with the industry – Good Fruit Grower
Small Fruit Sorter with InVision2 | TOMRA
How to Postharvest: PNW Dark Sweet Cherry Development Chart Index | WSU Tree Fruit | Washington State University
Fruit Matters articles may only be republished with prior author permission © Washington State University. Reprint articles with permission must include: Originally published by Washington State Tree Fruit Extension Fruit Matters at treefruit.wsu.edu and a link to the original article.
