Printable Handout – Station 2 Mitigating WA 38 greasiness
Problem
Peel greasiness can develop at any time, both before and throughout the cold chain, on many apple cultivars, including WA 38. Besides diminished appearance, greasiness or, potentially, mitigation using high amounts of fruit finish aids (waxes and/or shellac) can be associated with off-flavors.
Project Goal
1.Further define harvest maturity guidelines limiting the greasiness of WA 38 in the cold chain.
2.Establish ethylene mitigation protocols that reduce WA 38 greasiness for both conventional and organic production.
Background
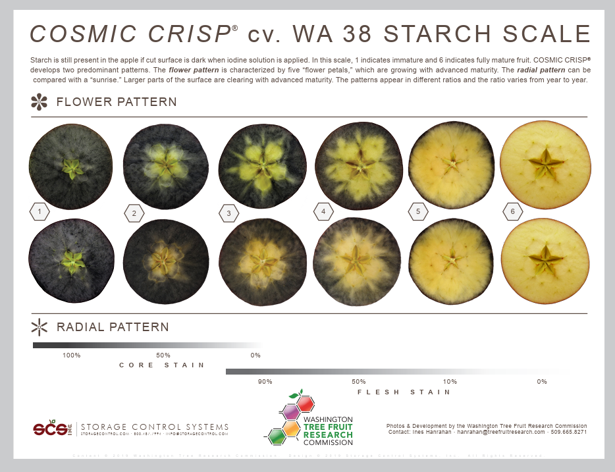
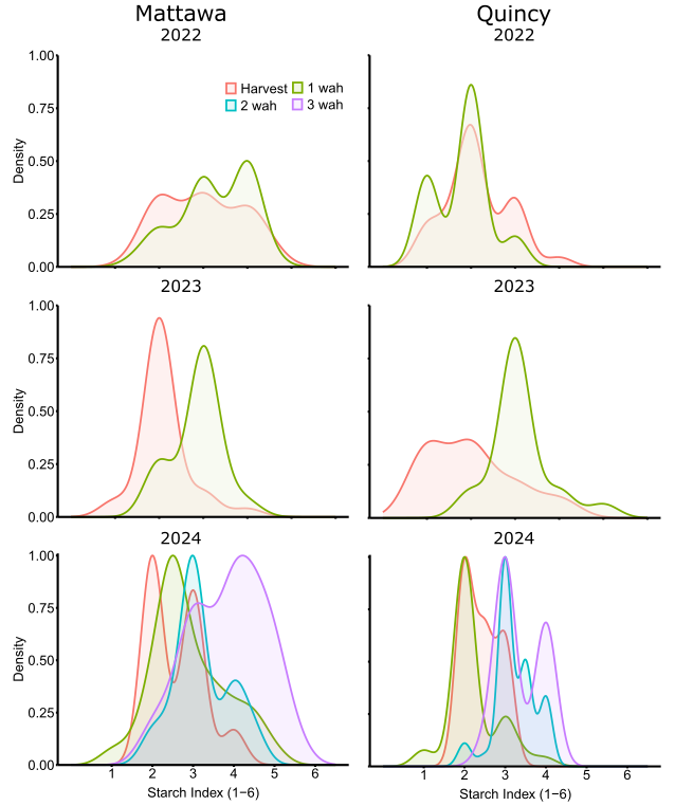
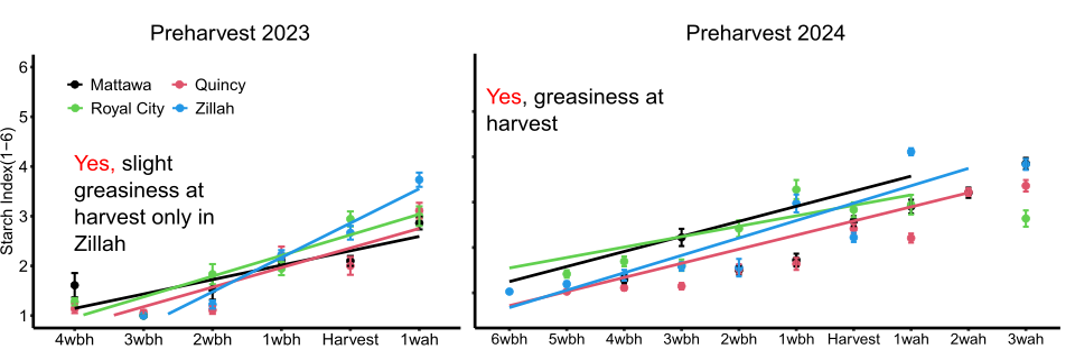
Harvest maturity and skin greasiness
Starch Index populations at different timepoints pre- and postharvest.
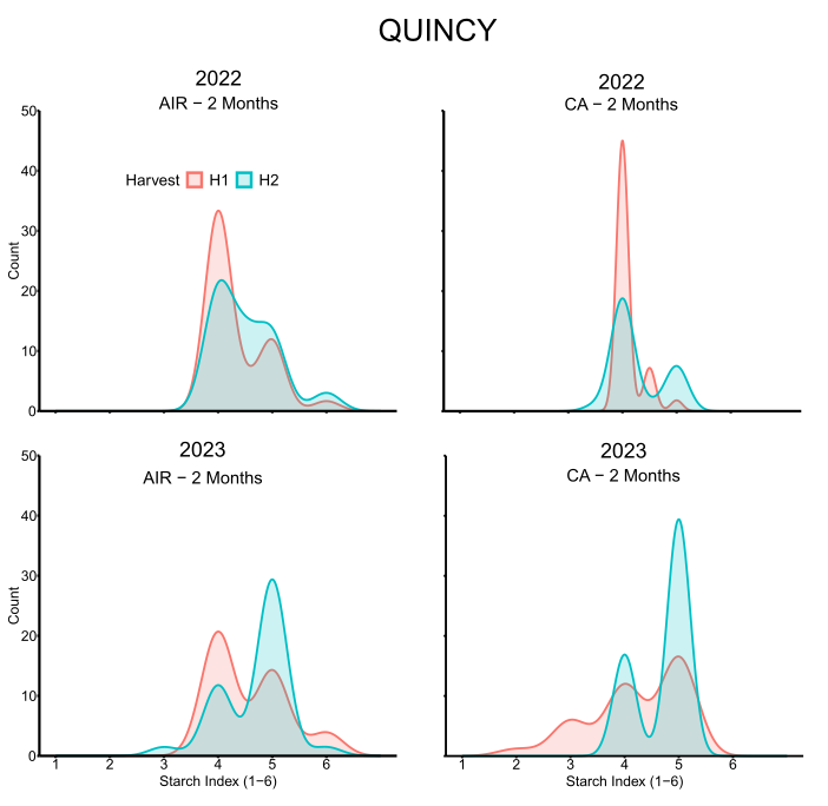
PGRs to Reduce Greasiness
Retain®
2022: No effect on greasiness incidence, but yes in severity, up to 4 months into storage (H1+1d)
Maturity: delayed starch degradation (H2), reduced ethylene production up to 4m into storage in H1.
2023: Reduced greasiness (incidence and severity) at harvest and 4m +1d 68oF
Maturity: delayed starch degradation (21 DBH), no consistent effect over C2H4.
Table 1. Retain®
| Year | Treatment | Material/a.i. | Rate | Timing | Others |
|---|---|---|---|---|---|
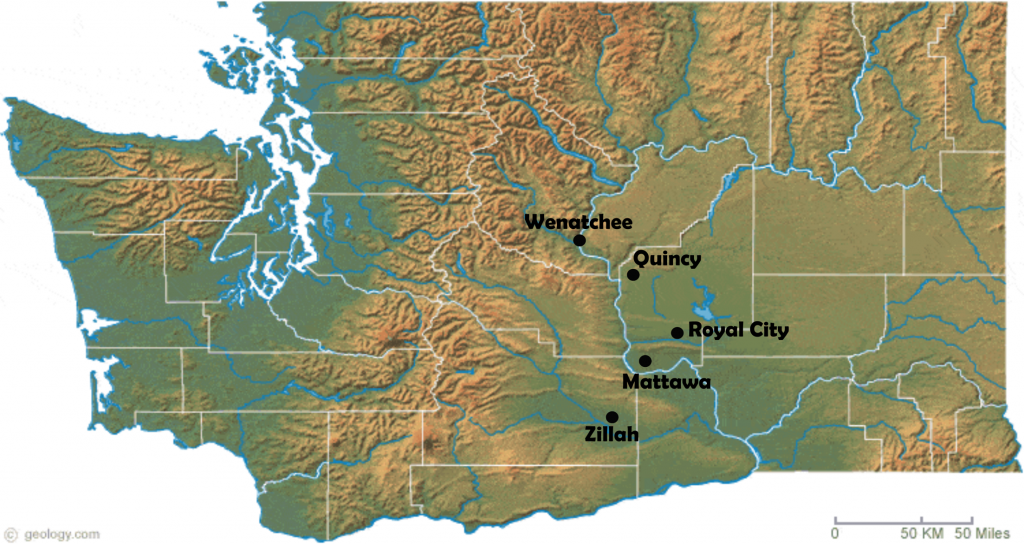
| 2022 | 1 | Untreated control (UTC) | NA | NA | Orchard location: Zillah, WA Sylcoat (0.1% OSi) added to Retain® applications. Two harvests: At the time of UTC (commercial), and 1 week later. |
| 2 | AVG (ReTain®) | Full rate (24 oz/acre) |
7 DBH | ||
| 3 | ReTain® | Half-rate (12 oz/acre) |
7 DBH | ||
| 2023 | 1 | Untreated control (UTC) | NA | NA | |
| 2 | AVG (ReTain®) | Full rate | 21 DBH | ||
| 3 | ReTain® | Full rate | 14 DBH | ||
| 4 | ReTain® | Full rate | 7 DBH | ||
| 2024 | 1 | Untreated control (UTC) | NA | NA | |
| 2 | AVG (ReTain®) | Full rate | 14 DBH | ||
| 3 | ReTain® | Double rate | 14 DBH | ||
| 4 | ReTain® | Double rate | 7 DBH |
1-MCP (HarvistaTM, SmartFreshTM)
2022: No consistent effect over greasiness (incidence and severity).
Maturity: significantly delayed softening, reduced ethylene production (mostly SF).
2023: No effect over greasiness.
Maturity: significantly delayed softening, reduced ethylene production (mostly SF).
Table 2. 1-MCP (HarvistaTM, SmartFreshTM)
| Year | Treatment | Material/a.i. | Rate | Timing | Others |
|---|---|---|---|---|---|
| 2022 & 2023 | 1 | UTC | NA | NA | Orchard location: Royal City, WA Two harvests: At the time of UTC (commercial), and 1 week later. Only harvest 1 for SF treats. |
| 2 | 1-MCP (HarvistaTM 1.3 SC) (1x) | Full dose | 14 DBH | ||
| 3 | HarvistaTM (2x) | Full dose | 14 & 7 DBH | ||
| 4 | UTC plus 1-MCP (SmartFreshTM; SF) | 100 ppm | At harvest | ||
| 5 | HarvistaTM 1x plus SF | T2 plus SF (100 ppm) | At harvest | ||
| 2024 | 1 | UTC | NA | NA | |
| 2 | UTC plus 1-MCP (SmartFreshTM; SF) | At 100 ppm | At harvest |
Final Remarks
- Maturity progression varies between sites. The starch degrades at different rates in different years.
- Fruit greasiness appears to be more related to fruit maturity and perhaps seasonal weather than just tree age.
- Overall, fruit from the 2022 season had lower greasiness incidence and severity than that of 2023 and 2024 seasons.
cooler weather > greasiness
- Slight less starch degradation in CA (less than 0.5 points)
- More greasiness during ‘shelf-life’
Funding
Washington Tree Fruit Research Commission
Contacts
Carolina Torres, PhD.
ctorres@wsu.edu
Associate Professor
Endowed Chair in Tree Fruit Postharvest Systems
Tree Fruit and Extension Center
Washington State University
Wenatchee, WA
